We show that superoscillating light fields, created using the method of optical eigenmodes, enable more efficient multiphoton-mediated cell transfection. Chinese hamster ovary cells are transfected with a plasmid and exhibit expression of DsRed-Mito in the mitochondria. We demonstrate an efficiency improvement of 35% compared to the diffraction-limited spot.
For more than 100 years, it has been generally accepted that the resolution of optical microscopy is fundamentally limited by the optics and the wavelength of light. The last two decades have shown this limit may be broken [1–4]. This has led to the emergence of advanced light microscopy techniques with resolution at the nanometer scale [5]. The ability to explore the nanoscale at optical wavelengths is not, however, restricted solely to imaging. A myriad of other topics in nanobiophotonics and nanolithography would benefit from light structuring beyond the diffraction limit.
Multiphoton processes are at the heart of numerous powerful methodologies in biophysics, imaging, ablation, and nanosurgery. To date, researchers have observed lithography and cutting of cellular structures using superresolved multiphoton light fields [6]. Excitingly, the use of ultrashort pulsed femtosecond lasers utilizing long pulse trains at megahertz repetition rates generates a low-density free-electron plasma that induces chemical decomposition (bond breaking) within the lipid bilayer. Crucially, this method is powerful as it is not related to heating or thermoelastic stresses. Indeed, thermally induced bubble formation needs to be avoided because the relatively large and long-lasting bubbles may cause damage, not only locally but beyond any laser focus position [7]. The particular use of high repetition rate femtosecond pulses is associated with the generation of free electrons through multiphoton ionization due to a stronger irradiance dependency [7,8]. Thus, the ability to tune parameters such as the peak power of laser light and concentrate its energy within an ever smaller focal region should bring significant benefits to this emerging process. In this article, we demonstrate the application of subdiffractive optical features to femtosecond laser-mediated transfection—the creation of transient submicrometer-sized pores in the cell membrane that rapidly self heal. The transient pores permit entry of extracellular nucleic acids such as DNA, RNA, and si-RNA into the cell [9,10]. Here, we observe a significant improvement in this process by the use of subdiffractive optical light fields. These light fields are created in the far field using the technique of optical eigenmodes (OEi) [11,12], permitting us to tune the focal spot size for cell transfection. We compare cell transfection efficiencies for various spot sizes, and thus numerical apertures (NA) of our optical system. Our results also reveal a key further advantage: we are able to increase the effective NA of a given optical system for cell transfection. In essence, this means we can realize large working distances for laser-mediated transfection yet obtain results that would be associated solely with very high-NA systems. This offers extended flexibility for nanoscale biomedical cell and tissue poration. Our results thus present a major advance for targeted cellular and subcellular gene delivery by light at the nanoscale.
2. OPTICAL EIGENMODE SUBDIFFRACTION BEAMS
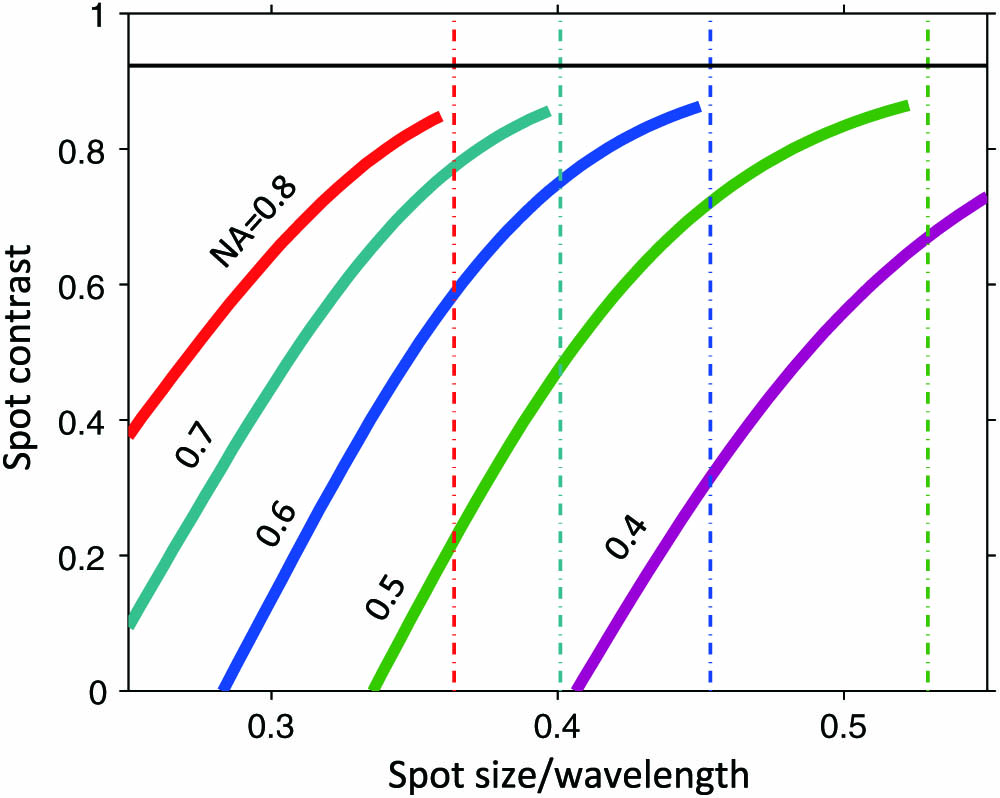
The OEi technique relies on the linear superposition of optical fields and the characterization of the focal spot size as a quadratic measure with respect to the incident field [11,12]. The method determines the complex amplitudes of multiple beam components to achieve the smallest possible spot size within a region of interest (ROI). More precisely, we consider a superposition of radially symmetric Bessel beams, each corresponding to a circle in reciprocal space. In general, the final resulting eigenmode beam is the same regardless of the superposition considered for as long as the initial set of beams used covers all the optical degrees of freedom. Other alternatives and equivalent beam families could include Laguerre–Gaussian, Hermite–Gaussian or variable deflections. The calculation of the subdiffraction spot is detailed in Appendix A. Here, we note that the OEi method delivers subdiffractive focal spots while creating intense sidebands on the outside of the ROI. Figure 1 shows the variation of the contrast ratio between the focal spot and the sidebands. We remark that for each NA considered, it is possible to create a focal spot that is smaller than the diffraction-limited case at the expense of a loss in contrast. Hence, this method allows the use of a longer working distance objective to deliver a focal spot equivalent to that obtained from a higher-NA objective. Due to its multiphoton dependence, photoporation and cell transfection enhance any linear contrast available, making OEi subdiffraction beams suitable in this case. Additionally, we remark that this spot does not require transversal vectors outside the bandwidth of the microscope objective. As such, the propagation of this beam is unobstructed in both directions and can be imaged after a reflection on a glass slide in the image plane. Figure 2 shows the theoretical [Figs. 2(a) and 2(b)] and experimental [Figs. 2(c)–2(e)] cross sections of the diffraction-limited beam [Figs. 2(a) and 2(c)] and the superresolved OEi beam [Figs. 2(b) and 2(d)]. Figures 2(c) and 2(d) show the irradiance measured via reflection for both beams, while Fig. 2(e) shows cross sections of the diffraction-limited beam (solid blue curve) and the superresolved focal beam (red dashed curve) obtained with a direct, subwavelength resolution measurement of the focal-plane fields using near-field scanning optical microscopy (NSOM) (see Appendix B). It can be seen that by diverting a modest fraction of the intensity to the sidebands, the OEi method enabled a considerable reduction of the full width at half-maximum (FWHM) of the central spot from 755 to 532 nm. Furthermore, power dissipation away from the focal area is less pronounced for multiphoton processes (see Appendix B). It is possible to compare the OEi beam used in this paper against other far-field subdiffractive beams by correcting for the wavelength and the NA used in each case (see Table 1). Indeed, in the linear regime, all focal spots scale with the wavelength used and are inversely proportional to the NA used. The higher the NA used, the larger the density of the optical degrees of freedom [13] that can be accessed by the objective.
Sign up for Photonics Research TOC. Get the latest issue of Photonics Research delivered right to you!Sign up now
Figure 1.Contrast ratio between the peak intensity of the focal spot and the peak intensity of the sidebands for different NA. The spot size is measured using the second-order momentum in the ROI and compared to the Airy disc for each NA considered (dot–dashed lines). The horizontal line indicates the contrast ratio for the Airy disc.
Figure 2.Comparison of theoretical and experimental light field cross sections of the photoporation beam. (a) and (b) Show the theoretical irradiance profiles of the sample, while (c) and (d) show the corresponding experimental images of the beam reflection from the coverslip, respectively, for the diffraction-limited (a),(c) and OEi beams (b),(d). The horizontal scale bar indicates a length of 1 μm. A focal-plane cross section determined using an NSOM is plotted in (e), for the diffraction-limited (thick solid blue line) and OEi beams (thin dashed red line). The maximum intensities are normalized to facilitate comparison. Using Gaussian fitting, it can be seen that the OEi method enables a reduction of the full width at half-maximum of the spot from 755 to 532 nm.
The concept of OEi decomposition further allows the determination and compensation of optical aberrations at the sample plane. Hence, the calculated aberration correction mask was combined with the phase-modulation masks on the spatial light modulator (SLM) to produce almost aberration-free focused beams at the sample plane (Appendix A). An optically base closed-loop feedback algorithm was used to counteract sample drift using an xyz nanostage (Appendix B).
3. RESULTS AND DISCUSSION
The transfection experiments were all performed using a femtosecond pulsed Ti:sapphire laser emitting at 800 nm, with pulse duration of 100 fs and a repetition rate of 80 MHz (Coherent, MIRA). As shown schematically in Fig. 3, the mode of the laser was expanded, through a magnifying telescope consisting of two lenses () and (), to overfill the liquid crystal panel of the SLM (Hamamatsu, LCOS-SLM, pixels). The laser exposure time and input power on the SLM were controlled through a laser shutter and a half-wave plate (HWP) combined with a polarizing beam splitter (PBS).
Figure 3.Optical cell transfection apparatus. A laser beam is magnified and is incident on the microdisplay of the SLM. The SLM is subsequently relayed, through a demagnified telescope, at the back focal plane of the microscope objective, housed within a Nikon Eclipse Ti inverted optical microscope. HWP, half-wave plate; PBS, polarizing beam splitter; L, lens; M, mirror; MO, microscope objective; CCD, charge-coupled device camera.
The SLM acts as a dynamic diffractive optical element and modulates the phase of the incident wavefront in the first-order configuration [17]. The SLM panel is subsequently imaged, through a demagnifying telescope consisting of two lenses, () and (), onto the exit pupil of a microscope objective (Nikon, , 0.65 NA), mounted on an inverted optical microscope (Nikon Eclipse Ti). The overall NA of the optical system is . A pinhole is employed at the back focal plane of lens in order to block the transmission of all but the first diffractive order through the microscope objective. The focused light field at the sample plane was collected and imaged, upon transmission through the microscope objective, on the chip of a high-resolution CCD camera (ANDOR, Clara).
In order to investigate the effects of the focal area on the efficiency of cell transfection, we performed optical transfection of Chinese Hamster Ovary (CHO-K1) cells by means of five focused light beams, all corresponding to different effective NAs : a superresolved OEi beam, a diffraction-limited beam of , and three focused beams of , 0.44, and 0.37, respectively. By sequentially changing the phase-modulation mask encoded on the SLM, the light distribution at the sample plane could be dynamically interchanged between focused beams of varying focal areas. Beams of lower NA were generated by truncating the mask imprinted on the SLM, effectively underfilling the back aperture of the microscope objective. For the sake of comparison, the peak intensity at the focal plane of each beam, as well as the number of laser exposures on each targeted cell, were kept constant throughout the experiments. However, due to the varying efficiency pertaining to the generation of each of the employed beams, the input power onto the SLM, as well as the laser exposure duration, were varied accordingly, to ensure constant energy (2 mJ) and peak power on each laser-treated cell. Specifically, individual cells were treated from below with three laser exposures, which, depending on the beam employed, varied from 20 to 60 ms, whereas the input power on the SLM varied from 370 mW to 1.2 W. The cell culture and sample preparation for these experiments are described in Appendix C.
Figure 4 compares the transfection efficiency achieved by employing beams of different focal area size. Each data point reflects the average transfection efficiency obtained, based on a complete set of five independently conducted transfection experiments involving the irradiation of 50 CHO-K1 cells within a given ROI, amounting to a total number of laser-treated cells per data point. The statistical significance of our results is demonstrated by the horizontal and vertical standard error (SE) bars for each data point [18]. As evident from Fig. 4, the transfection efficiency strongly depends on the focal area of the femtosecond beam targeting the cell membrane. In particular, the highest efficiency is obtained when cells are irradiated by the superresolved OEi beam that has the smallest focal area out of the investigated beams, showing altogether an increase in efficiency of 35%. The statistical significance of the difference was determined using Fisher’s exact method, yielding a two-tailed value of 0.0332. These experimental findings support the multiphoton theory of femtosecond membrane permeabilization [7], further underpinning the model of plasma-mediated membrane perforation. The improved efficiency can extend practical single-cell transfection to a wide range of interesting cell types and raises the potential for improved subcellular transfection, including more specific targeting of different parts of a polarized cell, e.g., a neuron [19], or possibly the apical versus basal region of epithelial cells.
Figure 4.Transfection efficiency as a function of the beam focal area shown for the subdiffraction OEi beam, for the diffraction-limited beam (), and for various spot sizes corresponding to , 0.44, and 0.37. Each data point reflects the average transfection efficiency obtained, corresponding to a total number of laser-treated cells for each focal area. A measure of the variability of the mean transfection efficiency, for five independently conducted trials, is represented by the vertical SE bars, whereas the statistical difference between the theoretical and experimentally estimated focal area values is indicated by the horizontal error bars.
APPENDIX A: DETERMINATION OF THE OPTICAL EIGENMODE
The superposition of radially symmetric Bessel beams that yields the subdiffraction beam for the experiments is determined using the OEi method. The electric vector field describing a linearly polarized Bessel beam with a topological charge and a half angle propagating along the axis is given by with where , , , and . Contrary to [20], this representation of the vectorial Bessel beam takes into account the angular spectral decomposition in the initial reciprocal space and its spectral density [21].
To create the smallest centered focal spot, we consider Bessel beam superpositions containing only terms and described by with . The total intensity, , incident in the ROI is given by where . The matrix can be decomposed into a set of eigenvectors delivering an orthonormal set of OE is defined as with and where is an eigenvalue and is the associated eigenvector.
To achieve the smallest spot, we represent the field in the focal plane as with the normalization condition . In this case, the measure of the spot size, , is defined by where . The eigenvector of having the smallest eigenvalue is the smallest achievable spot in the ROI considered. Finally, the coefficients are converted back to the initial Bessel beam superposition described by the coefficients .
Experimentally, the amplitudes and phases of these complex coefficients are implemented with the SLM. Each Bessel beam corresponds to an annular region on the SLM with a phase equal to the phase of and with diffraction efficiency equal to its amplitude. The final SLM mask consists of multiple concentric rings, each encoding the different coefficients related to the associated half angles .
We experimentally correct for optical aberrations using an eigenmode-based wavefront correction algorithm. In a first step, we measure the intensity operator describing the linear transfer between the SLM plane and the microscope’s imaging plane. This is done by interfering a reference beam () with each single probe beam (in this instance we chose the probe beams to correspond to transversal deflection in the SLM plane giving rise to transversal displacement in the image plane) and retrieving the relative phase and amplitude of the probe field in the image plane. Both beams, reference and probe, are encoded on the SLM using the random phase encoding [22] technique. The phase between the two beams is varied in four steps of , and the complex field is retrieved via where the term corresponds to intensity measured on the detector when illuminated by field . In general, the function f can be any function that has a Hermitian quadratic form with respect to the field. This procedure can be seen as a phase-sensitive lock-in technique in which the reference beam corresponds to a reference signal with respect to which the phase and amplitude of are measured. Using these measures, we can define the intensity operator . Its principal eigenvector defines the OEi that delivers the largest intensity on the detector maintaining the total power in the system.
APPENDIX B: ACTIVE DRIFT STABILIZATION AND BEAM PR
Stage drift may adversely affect the experiment; hence an active stabilization scheme was implemented. The procedure relies on an initial calibration of motion by acquiring at least seven images corresponding to a 3D cross and its center point. These images are analyzed using a principal component decomposition, which delivers a set of “eigenfaces” [23], representing the major variations in the image when moving the stage. Subsequently, we use the first four principal components of the current image to determine, through a linear transformation, the current drift and thus the nanostage position feedback that maintains a fixed position with respect to the optical path. This procedure was tested by stabilizing the position of gold nanoparticles while showing plasmonic resonances in the laser beam.
A direct, subwavelength resolution measurement of the fields at the focal plane was obtained using NSOM. An NSOM tip with a diameter of 30 nm, fiber coupled to a photomultiplier tube (Hamamatsu H6780-20), was scanned through the focal point while recording the signal via a lock-in amplifier (Stanford Research 830) with the reference signal provided by an optical chopper placed at a focal point in the illumination path.
Before the experiment, the optical system was calibrated. The optical aberrations were measured immediately at the NSOM tip by recording the lock-in amplified signal while a sequence of probe masks was sent to the SLM. Consequently the phase and amplitude were corrected at the SLM plane. Amplitude modulation was achieved with the phase-only SLM by modulating the diffracting efficiency toward higher orders. Sufficient accuracy in the amplitude modulation was assured by limiting the correction of the amplitudes that were reduced to less than 5% in the vicinity of the aperture edge.
Although the process of photoporation is not yet fully understood, it is generally accepted to be a multiphoton process. Uncertainty remains on the cardinality of the process; however, as Fig. 5 shows, the number of photons involved has little influence on the spot size of the OEi beam (dashed red line) relative to that of the diffraction-limited beam (solid blue line). Figure 5(a) shows the two-photon intensity calculated as the squared intensity of single-photon measurements using an NSOM probe in the focal plane of both beams, while Figs. 5(b) and 5(c) show the three- and five-photon intensities, respectively. The effective spot area for both illuminations reduces approximately inversely with the number of photons that are assumed to be involved in the photoporation process, while the sidelobes seen for the single-photon measurement in Fig. 2(e) are suppressed. This effect is particularly pronounced for higher-order processes where the irradiance approximates nearly a Gaussian profile.
Multiphoton comparison of the diffraction-limited beam and OEi beam: (a) two-photon, (b) three-photon, and (c) five-photon excitation. It can be noted that the sidelobes seen in Fig. 2(e) are suppressed, and that multiphoton OEi beams also reduce the focal spot size when compared to diffraction-limited multiphoton illumination.
APPENDIX C: CELL CULTURE AND SAMPLE PREPARATION
Prior to the cell transfection experiments, the CHO-K1 cells were seeded and cultured to subconfluence in 30 mm diameter glass-bottomed culture grade dishes (World Precision Instruments, UK) in 2 ml Modified Eagles Medium (Sigma, UK) solution with 10% foetal bovine serum (Sera Laboratories International), of penicillin (Sigma, UK), 2 mM L-glutamine, and μ streptomycin (Sigma, UK). The cells were subsequently incubated for 48 h in a humidified atmosphere of 95% air/5% at 37°C. For the transfection experiments, the cell monolayer was washed twice with OptiMEM and bathed in 300 μg of OptiMEM solution containing μ of mitoDSRed plasmid, which encodes a mitochondrially targeted Discoideum red fluorescent protein (BD Biosciences, UK). After laser treatment, the cell monolayer was further washed twice with OptiMEM, and subsequently 2 ml of cell culture medium was added before the cell sample was returned to the incubator. The transfection efficiency was defined as the ratio between successfully transfected cells and the total number of cells irradiated and was quantified by counting the successfully transfected cells expressing the red fluorescent protein 48 h after laser treatment. The control dishes were prepared using the same culture and preparation protocols. During the course of our transfection investigations, the passage number of the treated cells varied from 8 to 14.
[22] G. Spalding, J. Courtial, R. D. Leonardo. Holographic optical trapping. Structured Light and its Applications: An Introduction to Phase-Structured Beams and Nanoscale Optical Forces, 139-168(2008).