
Yuqing He, Wenjie Hu, Xiuqing Hu, Jibiao Zhu, Xingwei He, Weiqi Jin. Calibration Site BRDF Modeling Method Based on Ground and Low-Altitude UAV Joint Observation[J]. Acta Optica Sinica, 2023, 43(15): 1528001
- Acta Optica Sinica
- Vol. 43, Issue 15, 1528001 (2023)
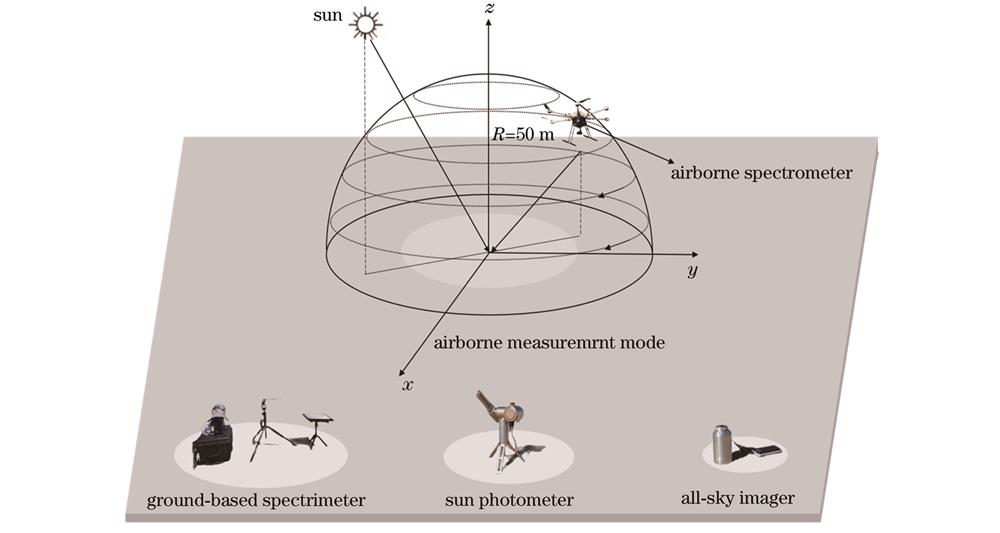
Fig. 1. Components and observing mode of the BRDF measurement system
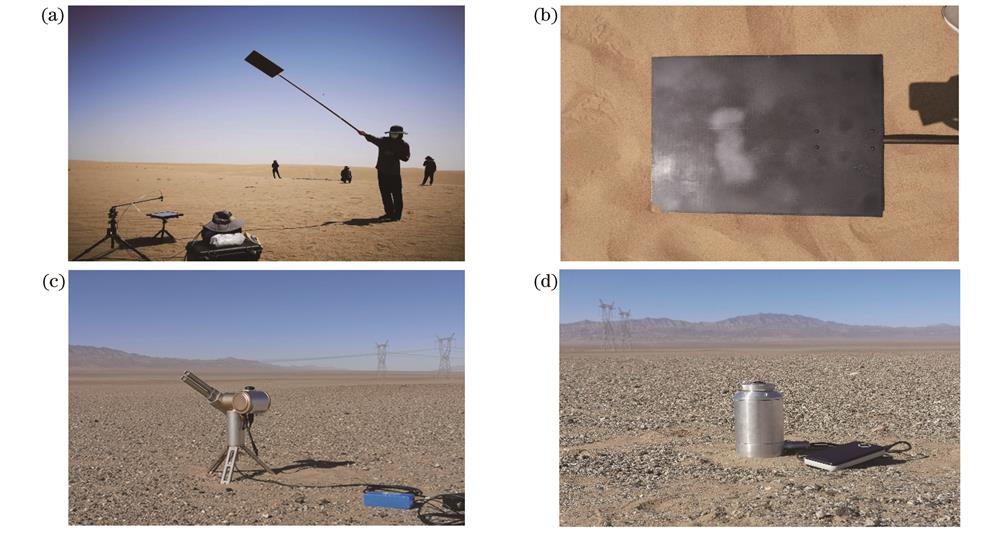
Fig. 2. Ground-based synchronous measurement system. (a) Ground-based spectrometer measurement system; (b) shading board; (c) solar radiometer; (d) all-sky imager
Fig. 3. Relationship between calibration coefficients of the reference panel and illumination angles
Fig. 4. Spectral radiance of each target observed synchronously by the airborne-ground observation system
Fig. 5. Surface features of field targets at different scales. (a) Satellite observation; (b) UAV observation; (c) ground observation
Fig. 6. Spatial distribution of target reflectance in the 555 nm band measured by the airborne spectrometer
Fig. 7. Measurement data of the ground-based spectrometer. (a) Variation of solar irradiance throughout the day; (b) variation of diffuse-to-total irradiance ratio throughout the day
Fig. 8. Relationship between spectral angle and wavelength shift between airborne and ground-based spectrometers
Fig. 9. Surface reflectance calculated before and after wavelength shift correction. (a) Before wavelength shift correction; (b) after wavelength shift correction
Fig. 10. Comparison of surface reflectance calculated by single and dual spectrometer method. (a) Calculation with a single spectrometer; (b) calculation with a dual spectrometer; (c) reflectance at 61 points in the 555 nm band
Fig. 11. Spatial distribution maps of ANIF at the 555 nm, 858 nm, and 1240 nm bands
Fig. 12. Changes in atmospheric environment during the measurement period. (a) Change of AOD with time;(b) change of cloud with time
Fig. 13. Total diffuse ratio and AOD at each measurement flight
Fig. 14. Relative bias of simulated reflectance values for different bands of BRDF models obtained on different days. (a) (b) Model bias on July 28th and July 30th before and after diffuse light correction; (c) (d) model bias on July 29th and July 30th before and after diffuse light correction
Fig. 15. Spatial distribution maps of ANIF at the 555 nm, 858 nm, and 1240 nm bands after diffuse light correction
|
Table 1. Observation data of the airborne BRDF measurement system
|
Table 2. Wavelength shifts at different wavelengths
| |||||||||||||||||||||||||||||||||||||||||||||||||||||||||||||||||||||||||||||||||||||||||||||||
Table 3. BRDF model coefficients for fitting three-day data
| |||||||||||||||||||||||||||||||||||||||||||||||||||||||||||||||||||||||||||||||||||||||||||||||
Table 4. Model coefficients after diffuse light correction
| |||||||||||||||||||||||||||||||||||||||||||||||
Table 5. Statistical analysis of the relative bias and standard deviation of simulated reflectance values for different bands of BRDF models obtained on different days

Set citation alerts for the article
Please enter your email address
© Copyright 2018-2021 | Chinese Laser Press. All Rights Reserved 沪ICP备15018463号-20