• Spectroscopy and Spectral Analysis
  • Vol. 41, Issue 7, 2175 (2021)
Ying CHEN1、1;, Zheng-ying LIU1、1;, Chun-yan XIAO2、2;, Xue-liang ZHAO1、1; 3;, Kang LI3、3;, Li-li PANG3、3;, Yan-xin SHI3、3;, and Shao-hua LI4、4;
Author Affiliations
  • 11. Hebei Province Key Laboratory of Test/Measurement Technology and Instrument, School of Electrical Engineering, Yanshan University, Qinhuangdao 066004, China
  • 22. School of Resources and Environment, Henan Polytechnic University, Jiaozuo 454000, China
  • 33. Center for Hydrogeology and Environmental Geology, China Geological Survey, Geological Environment Monitoring Engineering Technology Innovation Center of The Ministry of Natural Resources, Baoding 071051, China
  • 44. Hebei Sailhero Environmental Protection Hi-tech Co., Ltd., Shijiazhuang 050000, China
  • show less
    DOI: 10.3964/j.issn.1000-0593(2021)07-2175-06 Cite this Article
    Ying CHEN, Zheng-ying LIU, Chun-yan XIAO, Xue-liang ZHAO, Kang LI, Li-li PANG, Yan-xin SHI, Shao-hua LI. Overlapping Peak Analysis of Soil Heavy Metal X-Ray Fluorescence Spectra Based on Sparrow Search Algorithm[J]. Spectroscopy and Spectral Analysis, 2021, 41(7): 2175 Copy Citation Text show less
    Diagram of overlapping peaks
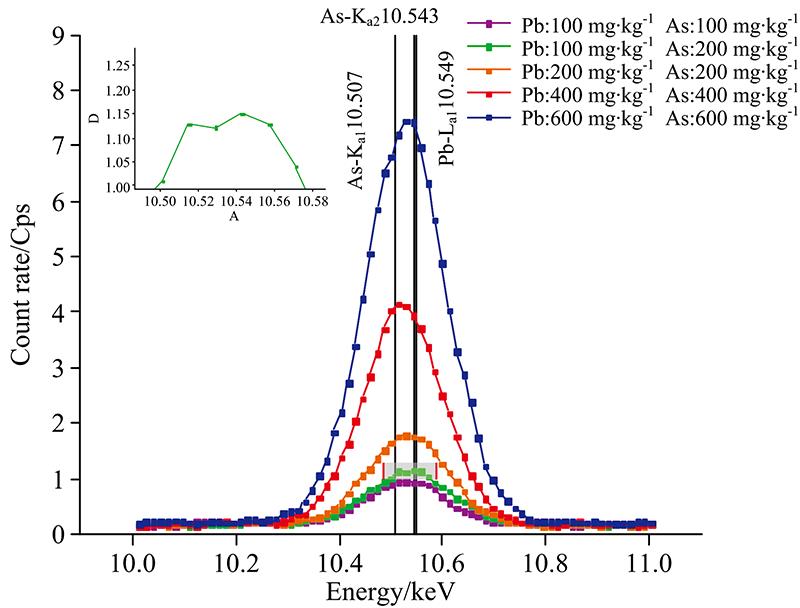
    Fig. 1. Diagram of overlapping peaks
    Spectral denoising and background subtraction before and after comparison(a): S-G smooth denoising;(b): Linear background minus background
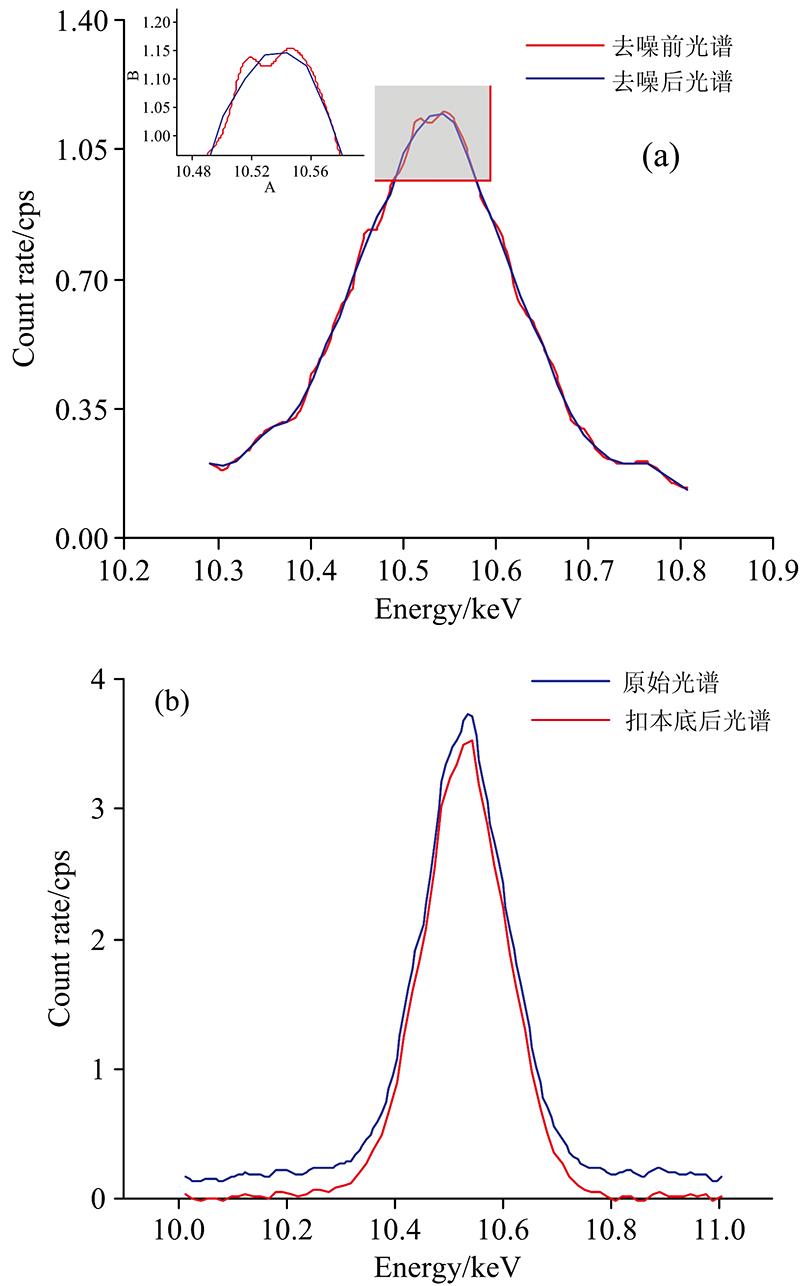
    Fig. 2. Spectral denoising and background subtraction before and after comparison
    (a): S-G smooth denoising;(b): Linear background minus background
    SSA flow chart
    Fig. 3. SSA flow chart
    Fitness value change curve of SSA
    Fig. 4. Fitness value change curve of SSA
    Diagram of overlapping peak decomposition results
    Fig. 5. Diagram of overlapping peak decomposition results
    组号预测面积误差率/%
    141.5424.27
    248.2412.05
    351.055.55
    Table 1. The error rate of Pb predicted area after EM algorithm decomposition
    重金属含量/
    (mg·kg-1)
    预测峰面积实际峰面积相对误差
    率/%
    10012.3814.880.064
    20021.8720.780.05
    40046.0344.060.041
    60054.8554.050.014
    Table 2. The error rate of Pb predicted area optimized by SSA
    重金属含量
    /(mg·kg-1)
    Pb-Lα1
    预测值
    Pb-Lα1
    误差率/%
    Pb-Kα1
    预测值
    Pb-Kα1
    误差率/%
    Pb-Kα2
    预测值
    Pb-Kα2
    误差率/%
    第一组10.6070.5510.5250.1710.4430.61
    第二组10.6080.5610.5170.2510.4180.85
    第三组10.5520.0310.4880.5210.3861.15
    Table 3. Position error of each peak after EM algorithm decomposition
    重金属含量
    /(mg·kg-1)
    Pb-Lα1
    预测值
    Pb-Lα1
    误差率/%
    As-Kα1
    预测值
    As-Kα1
    误差率/%
    As-Kα2
    预测值
    As-Kα2
    误差率/%
    Pb100-As20010.552 90.03610.5330.0910.453 90.5
    Pb100-As40010.571 80.210.537 60.0510.448 30.55
    Pb400-As60010.608 80.5610.526 10.1610.442 60.61
    Pb600-As40010.542 10.0610.671.210.511 80.045
    Table 4. Position error of each peak after SSA optimization
    Ying CHEN, Zheng-ying LIU, Chun-yan XIAO, Xue-liang ZHAO, Kang LI, Li-li PANG, Yan-xin SHI, Shao-hua LI. Overlapping Peak Analysis of Soil Heavy Metal X-Ray Fluorescence Spectra Based on Sparrow Search Algorithm[J]. Spectroscopy and Spectral Analysis, 2021, 41(7): 2175
    Download Citation