• Infrared and Laser Engineering
  • Vol. 49, Issue 3, 0305005 (2020)
Weiwei Jiang, Geyan Fu*, Jiping Zhang, Shaoshan Ji, Shihong Shi, and Fan Liu
Author Affiliations
  • School of Mechanical and Electric Engineering, Soochow University, Suzhou 215021, China
  • show less
    DOI: 10.3788/IRLA202049.0305005 Cite this Article
    Weiwei Jiang, Geyan Fu, Jiping Zhang, Shaoshan Ji, Shihong Shi, Fan Liu. Prediction of geometrical shape of coaxial wire feeding cladding in three-beam[J]. Infrared and Laser Engineering, 2020, 49(3): 0305005 Copy Citation Text show less
    " Three-beam" internal wire feeding system
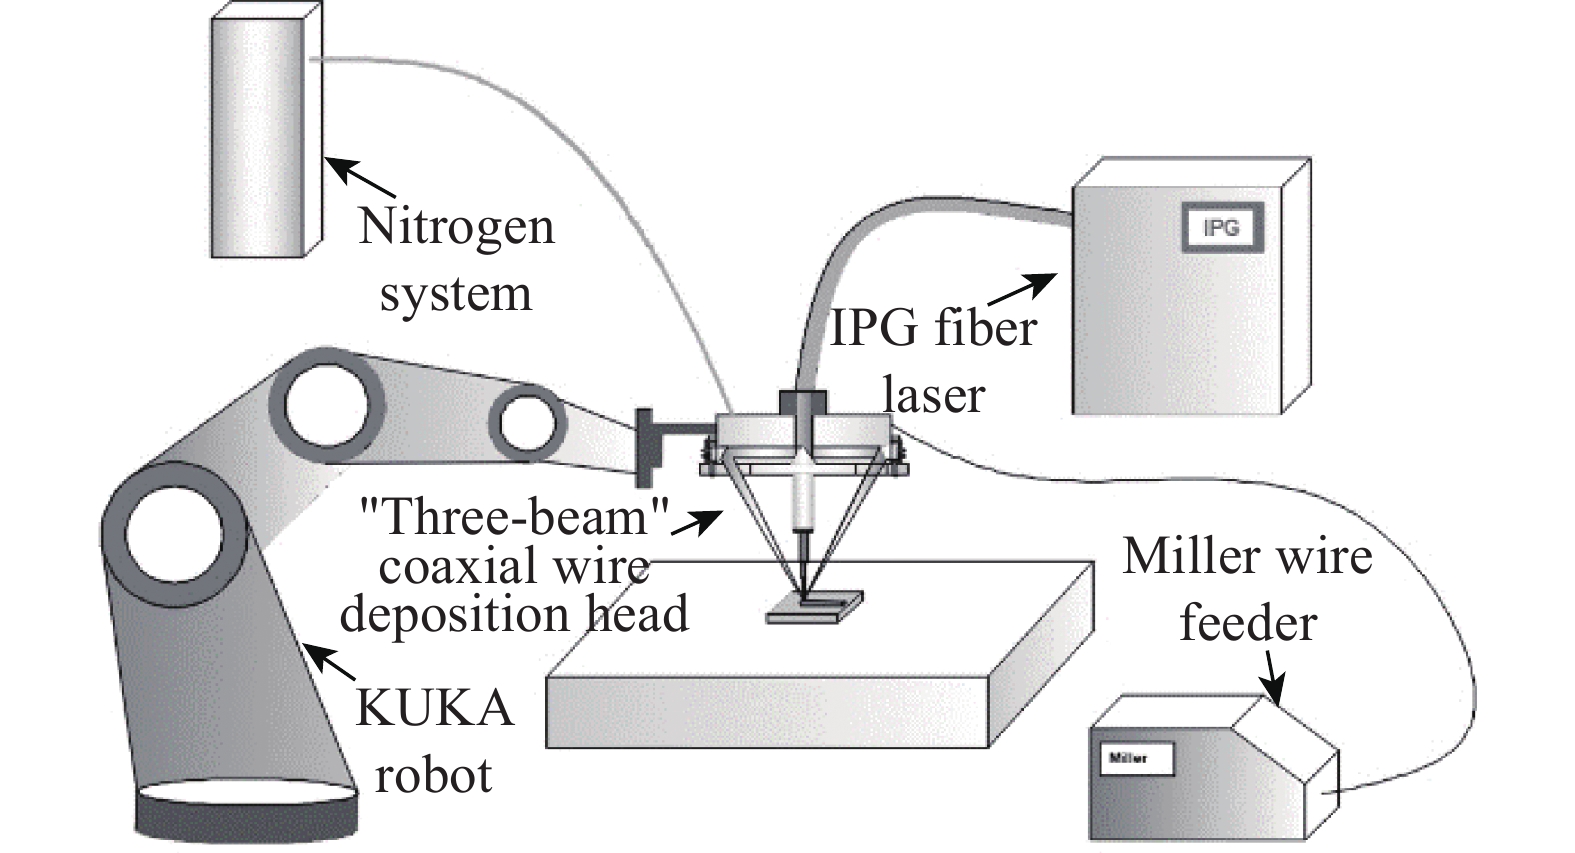
    Fig. 1. " Three-beam" internal wire feeding system
    Section morphology of cladding layer
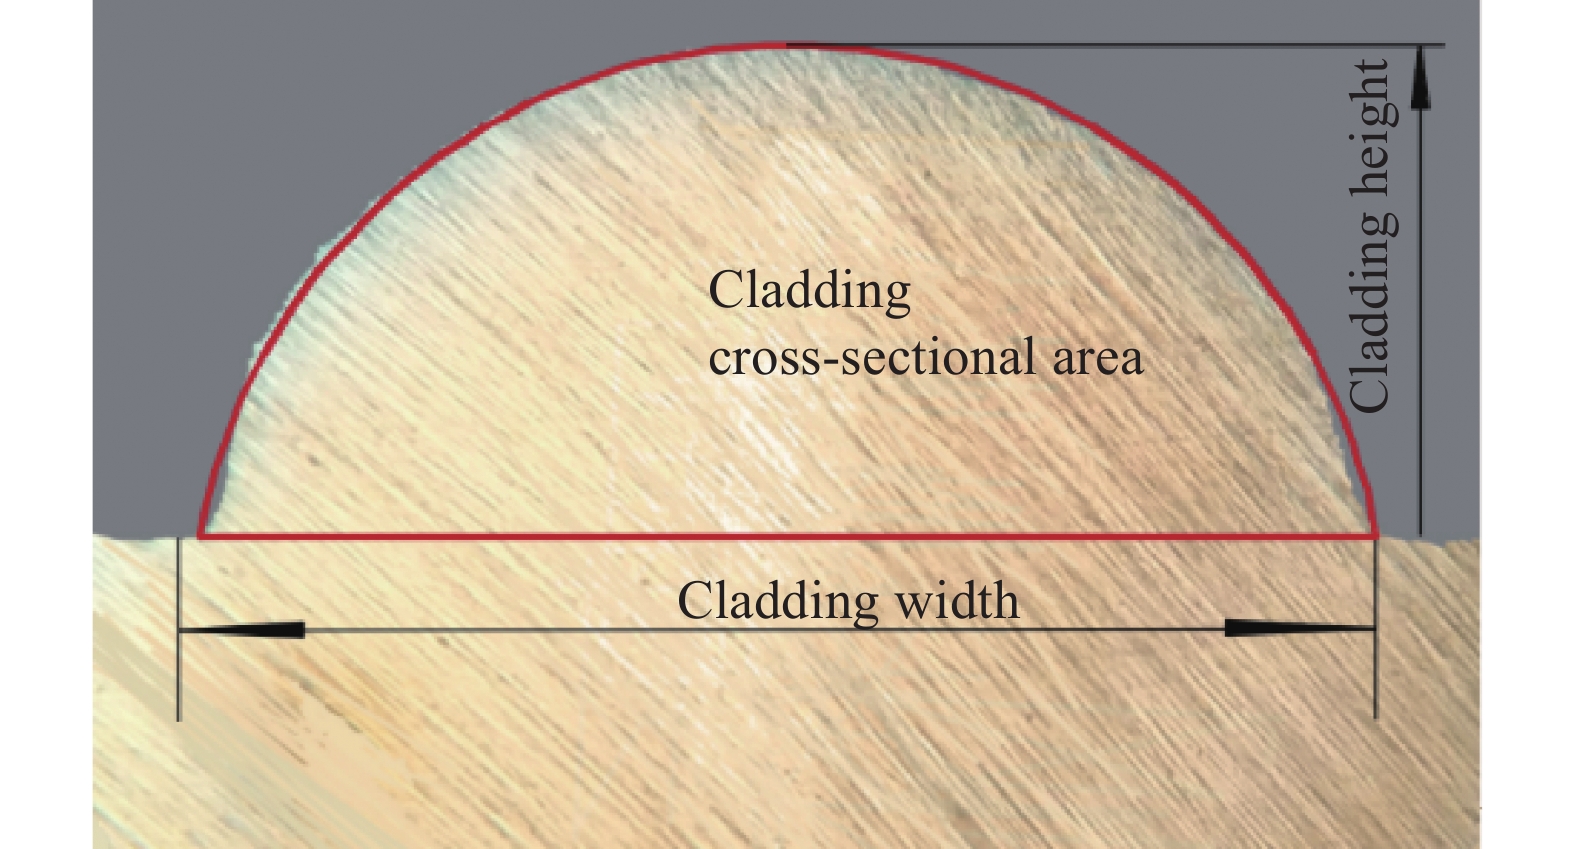
    Fig. 2. Section morphology of cladding layer
    BP neural network topology diagram of Coaxial wire feeding clad
    Fig. 3. BP neural network topology diagram of Coaxial wire feeding clad
    Adjustment parameter flow chart
    Fig. 4. Adjustment parameter flow chart
    Comparison of cladding width actual value and predicted value(a), comparison of cladding height actual value and predicted value and area actual value (b), comparison of cladding predicted value(c)
    Fig. 5. Comparison of cladding width actual value and predicted value(a), comparison of cladding height actual value and predicted value and area actual value (b), comparison of cladding predicted value(c)
    CompositionCMnSiPSCuFe
    Mass fraction0.07%1.53%0.85%0.011%0.01%0.12%Bal.
    Table 1. Composition of FRN-ER50-6 welding wire
    ExperimentFixed parametersVaried parameterCraft window
    Laser power single factor experiment Scanning velocity (Vs) Wire feeding velocity (Vf) Defocus(D) Power(P) [1 300, 1 700 W]
    5 mm/s14 mm/s−2 mm800 −1 800 W
    Scanning velocity single factor experiment Power (P) Wire feeding velocity(Vf) Defocus (D) Scanning velocity (Vs) [3, 7 mm/s]
    1 500 W14 mm/s−2 mm2 −10 mm/s
    Wire feeding velocity single factor experiment Power (P) Scanning velocity (Vs) Defocus (D) Wire feeding velocity(Vf) [9, 15 mm/s]
    1 500 W5 mm/s−2 mm8 −20 mm/s
    Defocus single factor experiment Power (P) Scanning velocity (Vs) Wire feeding velocity (Vf) Defocus (D) [−2.5, −1.5 mm/s]
    1 500 W5 mm/s14 mm/s−5 −1 mm
    Table 2. Single factor experiment table
    IndexP/W Vs/mm•s−1Vf/mm•s−1D/mm W/mm H/mm A/mm2Cladding layer morphology
    11 300.004.0010.00−2.503.451.142.81
    21 700.004.0013.50−1.753.851.142.99
    31 659.006.6013.97−2.323.640.681.67
    41 300.005.5010.00−2.503.370.801.93
    51 476.004.9713.57−1.553.311.172.78
    61 500.006.0011.50−2.503.630.822.09
    71 512.005.0214.31−1.833.201.102.56
    81 500.006.0015.16−2.503.331.102.50
    91 493.006.2112.43−1.663.090.791.71
    101 545.004.7111.04−2.173.401.062.56
    111 500.006.0014.63−2.503.360.942.09
    121 658.003.9211.04−1.873.541.173.02
    131 500.006.0016.80−2.503.311.212.74
    141 700.006.0010.50−2.003.730.681.72
    151 586.005.8711.73−2.153.840.832.19
    161 523.003.0611.73−1.833.621.453.97
    171 530.005.7612.43−2.093.300.851.95
    181 398.003.2611.04−1.613.381.373.40
    191 448.005.8611.73−2.043.130.881.95
    201 500.006.0018.20−2.503.241.342.93
    211 544.003.4812.06−2.073.351.323.25
    221 372.004.958.38−2.023.920.711.93
    231 597.006.2414.31−2.113.380.962.33
    241 343.003.039.86−1.983.501.233.14
    251 500.006.0015.00−1.503.441.022.49
    261 598.004.7012.06−2.293.581.042.63
    271 390.005.5013.97−1.953.101.012.23
    281 300.007.0010.00−2.503.310.631.49
    291 605.005.3314.31−1.543.081.042.32
    301 687.005.5212.43−1.513.350.882.08
    311 300.003.0010.00−2.503.591.323.54
    321 600.005.0010.50−2.253.590.852.10
    331 647.003.8913.97−2.223.541.313.23
    341 634.006.6913.57−1.943.420.872.06
    351 500.006.009.70−2.503.510.691.71
    361 500.006.0016.80−2.503.391.072.41
    371 500.006.0010.73−2.503.740.741.92
    381 523.003.0611.73−1.833.271.443.59
    391 700.006.0010.50−2.003.530.701.70
    401 600.004.0012.00−1.503.940.952.61
    411 661.004.2612.06−1.563.541.102.91
    421 500.004.0010.50−2.503.730.731.86
    431 300.005.0013.50−1.503.480.992.37
    441 559.003.2812.43−1.603.421.343.38
    451 300.005.0010.00−2.503.260.932.18
    461 300.006.0010.00−2.503.420.741.83
    471 693.006.3611.73−2.183.340.821.90
    481 500.006.0013.00−2.503.640.741.90
    491 600.006.009.00−1.753.260.621.42
    501 375.004.2212.43−2.053.181.152.64
    511 511.004.7514.31−1.723.271.222.87
    521 500.006.0010.00−2.503.600.761.90
    531 400.003.0010.50−1.503.481.273.22
    541 397.003.549.09−2.403.341.002.35
    551 400.004.009.00−2.253.520.852.10
    561 500.006.0017.47−2.503.331.122.57
    571 500.006.009.00−2.503.270.691.61
    581 500.006.0014.63−2.503.420.882.15
    591 316.005.6412.43−2.413.440.872.10
    601 649.003.719.86−2.053.451.002.45
    611 474.006.8013.97−2.283.440.641.48
    621 500.006.0013.00−2.503.550.882.11
    631 554.004.249.86−1.683.490.972.38
    641 565.006.6413.57−1.833.020.952.01
    651 607.004.6311.73−2.173.271.082.52
    661 500.003.0012.00−1.504.101.173.35
    671 300.003.009.00−2.503.651.012.55
    681 622.006.7114.31−1.843.230.902.00
    691 700.004.0013.50−1.754.031.103.13
    701 639.004.2612.06−1.933.501.082.69
    711 652.005.2513.57−1.683.451.072.64
    721 300.006.5010.00−2.503.590.701.74
    731 606.004.4012.06−2.073.621.072.70
    741 423.004.3211.04−2.323.451.042.53
    751 400.005.0015.00−1.753.531.082.66
    761 488.004.1311.04−2.403.480.952.23
    771 600.004.0012.00−1.503.960.852.38
    781 500.004.0010.50−2.503.790.792.10
    791 395.006.6713.57−1.833.150.821.77
    801 300.003.5010.00−2.503.751.203.25
    Table 3. Process parameters and experimental results of each deposition single-track
    Network parameterWidth-BPHeight-BPCross-sectional area-BP
    Learning rate0.50.10.1
    Maxium number of iterations1 0005 0005 000
    Training target error0.010.010.01
    The number of hidden neurous344
    Nodes of each hidden neurous
    Table 4. Neural network parameter table of cladding width, height and cross-sectional area
    MethodPredictive variableACC85%RMSE
    Quadratic regression modelCladding width100.00%0.21
    Cladding height66.67%0.13
    Cladding area73.33%0.28
    BP network modelCladding width100.00%0.21
    Cladding height100.00%0.07
    Cladding area93.33%0.24
    Table 5. Comparison of prediction ability between quadratic regression model and BP neural network model
    Weiwei Jiang, Geyan Fu, Jiping Zhang, Shaoshan Ji, Shihong Shi, Fan Liu. Prediction of geometrical shape of coaxial wire feeding cladding in three-beam[J]. Infrared and Laser Engineering, 2020, 49(3): 0305005
    Download Citation