• Journal of Geographical Sciences
  • Vol. 30, Issue 10, 1590 (2020)
Wenjiao SHI1、3、*, Changhe LU1、3, Xiaoli SHI2, and Jiaying CUI2
Author Affiliations
  • 1Key Laboratory of Land Surface Pattern and Simulation, Institute of Geographic Sciences and Natural Resources Research, CAS, Beijing 100101, China
  • 2Key Laboratory of Environmental Evolvement and Ecological Construction of Hebei Province, College of Resources and Environment Sciences, Hebei Normal University, Shijiazhuang 050024, China
  • 3College of Resources and Environment, University of Chinese Academy of Sciences, Beijing 100049, China
  • show less
    DOI: 10.1007/s11442-020-1801-0 Cite this Article
    Wenjiao SHI, Changhe LU, Xiaoli SHI, Jiaying CUI. Patterns and trends in grain self-sufficiency on the Tibetan Plateau during 1985-2016[J]. Journal of Geographical Sciences, 2020, 30(10): 1590 Copy Citation Text show less
    Distribution of land use types on the Tibetan Plateau
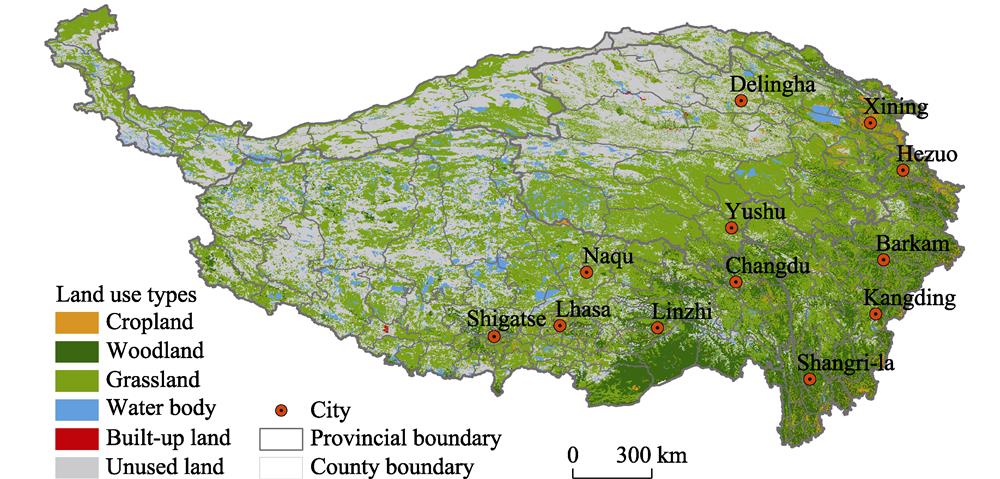
    Fig. 1. Distribution of land use types on the Tibetan Plateau
    Changes in capacity for grain self-sufficiency on the Tibetan Plateau
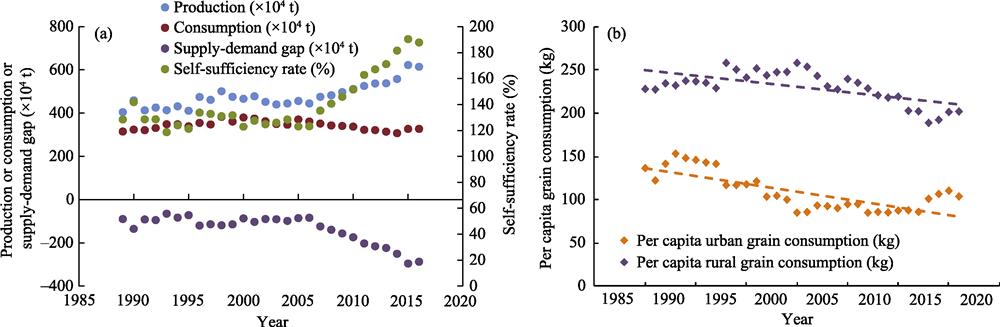
    Fig. 2. Changes in capacity for grain self-sufficiency on the Tibetan Plateau
    Capacity for grain self-sufficiency in different provincial-level regions that comprise the Tibetan Plateau between 2010 and 2016
    Fig. 3. Capacity for grain self-sufficiency in different provincial-level regions that comprise the Tibetan Plateau between 2010 and 2016
    Capacities for grain self-sufficiency at the county level on the Tibetan Plateau between 2010 and 2016
    Fig. 4. Capacities for grain self-sufficiency at the county level on the Tibetan Plateau between 2010 and 2016
    Changes in grain self-sufficiency on the Tibetan Plateau between 1985 and 2016
    Fig. 5. Changes in grain self-sufficiency on the Tibetan Plateau between 1985 and 2016
    CountyAdjustment in grain production (Pall)Adjustment in grain consumption (Call)
    MinlePall × 0.005Call × 0.002
    ShandanPall × 0.001Call × 0.001
    QiemoPall × 0.014Call × 0.024
    YutianPall × 0.006Call × 0.017
    MinfengPall × 0.042Call × 0.033
    Table 1.

    Revised methods for calculating grain supply and demand in marginal counties of the Tibetan Plateau

    Provincial componentPeriodProduction(×104 t)Consumption (×104 t)Self-sufficiency rate (%)Supply-demand gap (×104 t)
    Sichuan1985-1989113.3579.24143.05-34.11
    1990-1999125.9282.59152.47-43.33
    2000-2009122.6279.89153.49-42.73
    2010-2016135.0370.83190.63-64.20
    Yunnan1985-198955.5035.04158.37-20.46
    1990-199966.9845.53147.09-21.44
    2000-200979.7040.36197.48-39.34
    2010-201699.5938.35259.67-61.24
    Gansu1985-198954.7864.1085.479.31
    1990-199964.3572.1289.227.77
    2000-200976.9278.9897.392.06
    2010-201699.6661.82161.20-37.83
    Xinjiang1985-19890.821.7846.160.96
    1990-19991.192.0657.490.88
    2000-20091.262.2555.851.00
    2010-20162.672.9291.320.25
    Tibet1985-198951.7439.22131.94-12.52
    1990-199970.3549.98140.77-20.37
    2000-200994.4164.63146.07-29.78
    2010-201696.8671.77134.96-25.09
    Qinghai1985-1989105.0883.39126.01-21.69
    1990-1999113.3293.31121.44-20.01
    2000-200988.8491.6796.912.83
    2010-2016124.6176.68162.50-47.92
    Table 2.

    The changes of capacity for grain self-sufficiency in different provincial-level regions that comprise the Tibetan Plateau between 1985 and 2016

    Wenjiao SHI, Changhe LU, Xiaoli SHI, Jiaying CUI. Patterns and trends in grain self-sufficiency on the Tibetan Plateau during 1985-2016[J]. Journal of Geographical Sciences, 2020, 30(10): 1590
    Download Citation