
Wenjiao SHI, Changhe LU, Xiaoli SHI, Jiaying CUI. Patterns and trends in grain self-sufficiency on the Tibetan Plateau during 1985-2016[J]. Journal of Geographical Sciences, 2020, 30(10): 1590
- Journal of Geographical Sciences
- Vol. 30, Issue 10, 1590 (2020)
Abstract
1 Introduction
Food security is an essential component of national security and social stability (
Significant differences in capacity for grain self-sufficiency on the TP have been reported at different spatiotemporal scales. At the regional scale, some previous work has shown that it has been difficult for total grain production on the TP to meet demand (
Here, we studied grain supply and demand on the TP based on grain production, population, and per capita consumption data collected at the county level between 1985 and 2016. We distinguished variations in consumption within urban and rural areas at the county level within each region. Spatiotemporal variations in capacity for grain self-sufficiency on the TP at regional, provincial, and county levels between 1985 and 2016 were evaluated systematically. Our studies can provide a foundation for building an eco-security barrier and a regulation of spatial strategy for regional agriculture and animal husbandry on the TP.
2 Data and methods
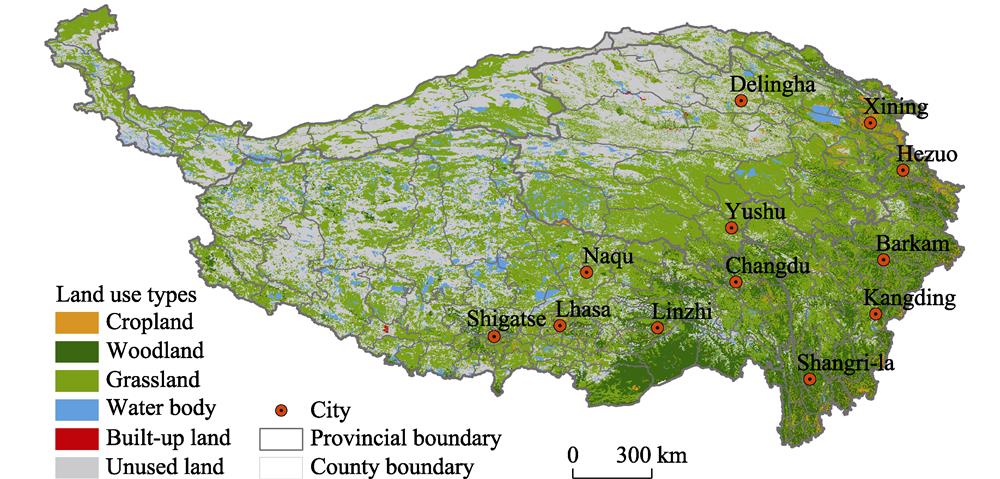
2.1 Study area
The TP includes 205 counties and is located in southwest China, including Qinghai and Tibet as well as some parts in Sichuan, Yunnan, Gansu, and Xinjiang provincial-level regions (
![]()
Figure 1.
2.2 Data
2.2.1 Land use types
Land-use type data for 2015 were downloaded from the Resource and Environmental Science Data Center of Chinese Academy of Sciences (
2.2.2 Grain supply and demand
Data on grain supply and demand, including production at provincial and county levels, as well as per capita annual grain consumption for urban and rural residents (1985-2016) were extracted from the Qinghai Statistical Yearbook (1985-2017), the Tibet Statistical Yearbook (1993-2017), the Gansu Development Yearbook (1984-2017), the Yunnan Statistical Yearbook (1984-2017), the Xinjiang Statistical Yearbook (1989-2017), and the Sichuan Statistical Yearbook (1987-2017).
2.2.3 Population data
Provincial- and county-level population data, including resident populations at year-end as well as urban and rural resident population between 1985 and 2016, were extracted from the Qinghai Statistical Yearbook (1985-2017), the Tibet Statistical Yearbook (1993-2017), the Gansu Development Yearbook (1984-2017), the Yunnan Statistical Yearbook (1984-2017), the Xinjiang Statistical Yearbook (1989-2017), the Sichuan Statistical Yearbook (1987-2017), China Population Census Data by County, and the China Population and Employment Statistical Yearbook (1988-2017).
2.3 Methods
2.3.1 Grain consumption
Grain consumption was calculated as follows:
where $C{{A}_{k}}$,
2.3.2 Indicators of grain self-sufficiency
The supply-demand gap as well as the self-sufficiency rate were used to assess the current situation and trends in grain self-sufficiency on the TP. The supply-demand gap was calculated as follows:
where
The self-sufficiency rate was calculated as follows:
where
2.3.3 Trend analysis
The slope of the supply-demand gap and self-sufficiency rate for grain on the TP were analyzed as follows:
where
2.3.4 Supply and demand data processing in marginal counties
A total of 11 counties are not fully included within the scope of the TP; they are Yecheng, Minfeng, Yutian, Cele, Pishan, Hotan, Qiemo, Ruoqiang, Aktao, Minle, and Shandan. Supply and demand data for these counties were therefore processed by first calculating the proportion of cropland on the plateau in each case and then calculating the proportion of residential area. Grain production, consumption, self-sufficiency rate, and the supply-demand gap for marginal counties lacking settlements were then reported as non-residential areas and were not included subsequently. Finally, marginal counties encompassing residential areas were identified as Qiemo, Yutian, Minfeng, Minle, and Shandan counties. Grain production and consumption values for these areas were then calculated based on the proportion of cropland and built-up area in each case, respectively (
| County | Adjustment in grain production ( | Adjustment in grain consumption ( |
|---|---|---|
| Minle | ||
| Shandan | ||
| Qiemo | ||
| Yutian | ||
| Minfeng |
Table 1.
Revised methods for calculating grain supply and demand in marginal counties of the Tibetan Plateau
3 Results and analysis
3.1 Spatiotemporal variation in grain self-sufficiency across the whole TP
3.1.1 The current situation
Grain production generally meets local needs on the TP. Grain production on the TP is mainly distributed within the basins of ‘the Yarlung Zangbo River and its two tributaries’ as well as in the eastern part of Qinghai Lake. Between 2010 and 2016, average annual total grain production and consumption values for the TP were 558.12 × 10⁴ t and 322.56 × 10⁴ t, respectively, revealing that there was no supply-demand gap across the whole TP (
3.1.2 Trends in grain self-sufficiency
Total grain production on the TP has maintained a relatively steady increase since 1989, with an average annual change of 5.70 × 10⁴ t, especially since 2005 (
![]()
Figure 2.
3.2 Spatiotemporal differences in grain self-sufficiency at the provincial level
3.2.1 The current situation
Between 2010 and 2016, the parts of Yunnan, Sichuan, Qinghai, Gansu and Tibet had higher than 100% of grain self-sufficiency rates in an order from high to low (
![]()
Figure 3.
3.2.2 Change of provincial grain self-sufficiency capacity
In terms of grain production, the parts of Yunnan, Gansu, Xinjiang, and Tibet encompassed by the plateau all experienced continuous increase over the study period, while the parts of Sichuan and Qinghai provinces underwent increasing-decreasing-increasing trends, with average annual production values of 135×104 t and 125×104 t, respectively. In terms of grain consumption, the parts of Sichuan, Gansu, Yunnan, and Qinghai encompassed by the plateau all increased initially and then decreased. Consumption between 2010 and 2016 was lower than that between 1985 and 1999 apart from that in the Yunnan component of the plateau. Consumption in Xinjiang and Tibet increased continuously; these reached 2.92×10⁴ t and 71.77×10⁴ t recently, respectively. Regarding grain self-sufficiency rates between 2010 and 2016, all regions experienced increases between 1985 and 1999, but values for Xinjiang and Gansu components of the plateau remained still less than 100%. In terms of the grain supply-demand gap, Sichuan, Yunnan, Tibet, and Qinghai components of the plateau were all self-sufficient over the four time periods (except for Qinghai during the period of 2000-2009), while Xinjiang and Gansu parts experienced a gap throughout the first three time periods. The average annual grain supply-demand gap for all the provincial-level regions apart from Xinjiang remained less than zero between 2010 and 2016 (
| Provincial component | Period | Production | Consumption | Self-sufficiency rate (%) | Supply-demand gap (×104 t) |
|---|---|---|---|---|---|
| Sichuan | 1985-1989 | 113.35 | 79.24 | 143.05 | -34.11 |
| 1990-1999 | 125.92 | 82.59 | 152.47 | -43.33 | |
| 2000-2009 | 122.62 | 79.89 | 153.49 | -42.73 | |
| 2010-2016 | 135.03 | 70.83 | 190.63 | -64.20 | |
| Yunnan | 1985-1989 | 55.50 | 35.04 | 158.37 | -20.46 |
| 1990-1999 | 66.98 | 45.53 | 147.09 | -21.44 | |
| 2000-2009 | 79.70 | 40.36 | 197.48 | -39.34 | |
| 2010-2016 | 99.59 | 38.35 | 259.67 | -61.24 | |
| Gansu | 1985-1989 | 54.78 | 64.10 | 85.47 | 9.31 |
| 1990-1999 | 64.35 | 72.12 | 89.22 | 7.77 | |
| 2000-2009 | 76.92 | 78.98 | 97.39 | 2.06 | |
| 2010-2016 | 99.66 | 61.82 | 161.20 | -37.83 | |
| Xinjiang | 1985-1989 | 0.82 | 1.78 | 46.16 | 0.96 |
| 1990-1999 | 1.19 | 2.06 | 57.49 | 0.88 | |
| 2000-2009 | 1.26 | 2.25 | 55.85 | 1.00 | |
| 2010-2016 | 2.67 | 2.92 | 91.32 | 0.25 | |
| Tibet | 1985-1989 | 51.74 | 39.22 | 131.94 | -12.52 |
| 1990-1999 | 70.35 | 49.98 | 140.77 | -20.37 | |
| 2000-2009 | 94.41 | 64.63 | 146.07 | -29.78 | |
| 2010-2016 | 96.86 | 71.77 | 134.96 | -25.09 | |
| Qinghai | 1985-1989 | 105.08 | 83.39 | 126.01 | -21.69 |
| 1990-1999 | 113.32 | 93.31 | 121.44 | -20.01 | |
| 2000-2009 | 88.84 | 91.67 | 96.91 | 2.83 | |
| 2010-2016 | 124.61 | 76.68 | 162.50 | -47.92 |
Table 2.
The changes of capacity for grain self-sufficiency in different provincial-level regions that comprise the Tibetan Plateau between 1985 and 2016
3.3 Spatiotemporal variation in grain self-sufficiency at the county level
3.3.1 The current situation
Counties characterized by grain production values more than 15.00 × 10⁴ t on the TP are mainly distributed in eastern Qinghai, central-south Tibet, and in areas adjacent to Sichuan-Tibet (
Fifty-nine percent of counties with grain self-sufficiency rates higher than 100% are mostly distributed in the basins of ‘the Yarlung Zangbo River and its two tributaries’ (including Linzhou, Dazi, Qushui, Lazi and Bailang counties as well as Duilong Deqing District), in areas adjacent to Sichuan-Tibet (including Chayu, Daocheng, Muli, and Batang counties), in regions around Qinghai Lake (including Menyuan, Gonghe, and Guinan counties), and in agricultural areas of eastern Qinghai (including Huangzhong, Ping’an and Ledu counties as well as Minhe Hui and Tu Autonomous County), where cropland area is large (Figures 4c and 4d). Average grain self-sufficiency rates for counties (districts) within Lhasa City (237.68%) were higher than those recorded for other cities. Indeed, apart from urban areas within Xining, self-sufficiency rates for other counties within this city were all greater than 100% (between 133.20% and 392.08%). Counties (districts) within the cities of Xigaze (197.63%), Linzhi (170.32%), and Changdu (100.99%) all conform to this trend. Most recorded grain self-sufficiency rates were higher than 100% with the exception of Gongbujiangda County within Xigaze City. Rates recorded for Jiangda, Wuqi, Chaya, and Basu counties as well as for Karuo District within Changdu City were less than 100% (Figures 1, 4c and 4d).
Counties with grain self-sufficiency rates less than 100% are mainly distributed within animal husbandry areas in the headwater regions of the Yangtze and Yellow rivers (including Zaduo, Zhiduo, Nima, and Gaize counties as well as other animal husbandry regions), in Hoh Xili semi-desert areas (including Ritu and Shuanghu counties), as well as in Qiangtang Plateau Tibetan pastoral areas (including Cuoqin, Zhongba, and Geji counties) where annual grain production values are less than 0.50 ×10⁴ t.
![]()
Figure 4.
3.3.2 Changes in capacity for grain self-sufficiency at the county level
Counties that have experienced significant increases in grain production on the TP are mainly distributed within major producing areas in southeastern Tibet. Significant decreases have occurred within Aba Tibetan Autonomous Prefecture in Sichuan Province, in some counties inside Xining City, as well as in Qilian, Gangcha, Yushu, and Maqin counties in Qinghai (
![]()
Figure 5.
4 Discussion
4.1 Factors influencing changes in grain self-sufficiency
The factors influencing grain self-sufficiency and changes in this variable on the TP include cropland area, population size, adjustments in the consumption structure of residents, total power of agricultural machinery, regional agricultural production and so on. Cropland area has been the dominant factor influencing spatial patterns in grain self-sufficiency across the TP. Areas characterized by high grain self-sufficiency values are mainly distributed in regions where cropland area is also large, such as the Tibetan River Valley and agricultural areas in eastern Qinghai. Similarly, counties with low grain self-sufficiency tend to have less cropland and are mainly distributed in significant pastoral areas such as in Naqu, Ali, Yushu, and Guoluo counties (
Change in grain demand on the TP are closely related to population size. Between 1985 and 2016, the per capita annual grain consumption of residents in urban and rural areas decreased by 32.68 kg and 25.94 kg, respectively. Although the overall population of the TP has annually increased by 311.8 thousand persons, the total grain consumption has not changed significantly (
4.2 Comparison with previous researches
In previous researches,
Different per capita grain consumption standards were used in previous researches to calculate regional demand.
Two key features are highlighted here compared with previous studies. First, the fact that regional heterogeneity was considered when calculating consumption. We used annual per capita grain consumption in urban and rural areas for provincial-level regions on the TP and combined these values with the urban and rural population of each county to obtain values for total grain consumption. This approach enabled us to reflect heterogeneity in different provincial-level regions and also distinguish differences in consumption between urban and rural areas. Per capita grain consumption in urban areas has been lower than in rural areas across the TP; at the same time, the urban population of this region has gradually increased while the rural one has decreased and so total consumption across the plateau has also fallen slightly. Secondly, we have analyzed differences in grain self-sufficiency across multiple scales in this study, including regional, provincial, and county levels.
4.3 Study limitations
This study has some limitations. First, due to a lack of detailed data regarding feed, industrial grain and so on in each county, the grain consumption did not include these types of grain in the evaluation of self-sufficiency in this study. In addition, wheat, highland barley, rice, legume, and potato were all included in grain supply calculations, but detailed grain classifications were not included in consumption calculations. Annual grain consumption per person was only assessed here using urban and rural yearbook values. Furthermore, we also did not take into account the impact of the tourist population on grain consumption in this study. Some other studies suggest that the annual grain consumption of the tourist population on the TP reaches 17.95×10⁴ t, so the risk of a food security impact remains relatively small (
5 Conclusions
We considered differences in per capita grain consumption in urban and rural areas of the TP, and systematically explored heterogeneity in grain self-sufficiency at regional, provincial, and county scales between 1985 and 2016. We paid special attention to spatial distributions and trends in grain self-sufficiency at the county scale. The results of this analysis reinforce the scientific basis for regulation of grain supply and demand spatial distribution on the TP.
Between 2010 and 2016 counties with a grain self-sufficiency rate higher than 100% account for 59% of total regions. Counties where there has been an obvious increase in this rate account for 36%, while 16% experienced a significant decrease. In terms of counties with self-sufficiency rates higher than 100%, 82% and 92% of this group are located in the basins of ‘the Yarlung Zangbo River and its two tributaries’ as well as agricultural areas in eastern Qinghai because these places have more cropland. We also reveal obvious spatiotemporal differences in grain self-sufficiency across the TP. Production has significantly increased in agricultural and pastoral areas across southeastern and southern Tibet, while consumption has increased markedly in central-south and southeastern regions. It is also clear that the grain self-sufficiency rate has increased significantly in agricultural areas across eastern Qinghai as well as in southeastern Tibet. Headwater regions of the Yangtze and Yellow rivers as well as the Qiangtang Plateau have experienced insufficiencies in grain supply. Overall, grain on the TP is able to meet local demand. However, spatial variations in grain supply and demand on the plateau are significant. It is important that we emphasize strengthening grain supply and regulation in particular in areas near major cities.
References
[1] Cheng SK, Min QW. Strategies of agriculture and animal husbandry development in Tibet Autonomous Region. Resources Science, 24, 1-7(2002).
[2] Cheng SK, ShenL. The strategy of regional sustainable development on the Qinghai-Tibet Plateau. Resources Science, 22, 2-11(2000).
[3] DuanJ, XuY, Sun XY. Spatial patterns and their changes of grain production, grain consumption and grain security on the Tibetan Plateau. Journal of Natural Resources, 34, 673-688(2019).
[4] FukaseE, MartinW. Who will feed China in the 21st century? Income growth and food demand and supply in China. Journal of Agricultural Economics, 67, 3-23(2016).
[5] Gao LW, Xu ZR, Cheng SK et al. Food security situation and major grain supply and demand on the Tibetan Plateau. Journal of Natural Resources, 32, 951-960(2017).
[6] Gu SZ. On food security situation and countermeasures in Tibet Autonomous Region. Journal of Natural Resources, 15, 305-314(2000).
[7] HuT, Ju ZS, ZhouW. Regional pattern of grain supply and demand in China. Acta Geographica Sinica, 71, 1372-1383(2016).
[8] JinT, XiaQ, Yue MM et al. Supply-demand balance evaluation in grain-feed perspective: The case of Jiangsu Province. Economic Geography, 36, 136-141(2016).
[9] LiuJ, Li XM, Zhong XH. Consumption structure of food and the countermeasure of grain in Tibet. Journal of Mountain Science, 22, 286-291(2004).
[10] Min QW, Cheng SK, Zhong ZM. Development orientation of agriculture and animal husbandry in Qinghai-Tibet Plateau. Research of Agricultural Modernization, 24, 335-338(2003).
[11] Nie FY, Bi JY, Zhang XB. Study on China’s food security status. Agriculture and Agricultural Science Procedia, 1, 301-310(2010).
[12] Qi XX, Vitousek PM, Liu LM. Provincial food security in China: A quantitative risk assessment based on local food supply and demand trends. Food Security, 7, 621-632(2015).
[13] Shangguan ZP. Grain production and sustainable development in Northwest China. Transactions of the Chinese Society of Agricultural Engineering, 14, 19-24(1998).
[14] Shen RP, GuoQ, Chen PP et al. Impact of high resolution atmospheric forcing and plant functional types datasets on soil temperature simulation in the Tibetan Plateau. Plateau Meteorology, 38, 1129-1139(2019).
[15] Su BQ, Wang YY, Shangguan ZP. Effect of reverting farmland to forest project in Northwest China on grain production and farmers’ livelihood. Bulletin of Soil and Water Conservation, 37, 247-252(2017).
[16] WangQ, Liu XH, Yue TX et al. Using models and spatial analysis to analyze spatio-temporal variations of food provision and food potential across China’s agro-ecosystems. Ecological Modelling, 306, 152-159(2015).
[17] WangW, Yan HM, Yang YZ et al. Evaluation of land resources carrying capacity of Tibetan counties based on dietary nutritional demand. Journal of Natural Resources, 34, 921-933(2019).
[18] WenJ. Functions, patterns and countermeasures combining farming with stock breeding on the Qinghai-Tibet Plateau. Journal of Natural Resources, 15, 56-60(2000).
[19] Wu JS, Jiang PP, Huang XL et al. Spatial-temporal analysis of grain supply and demand in rapid urbanization regions in Eastern China: A case study of Guangdong Province. Journal of Natural Resources, 28, 253-265(2013).
[20] Xie GD, Cheng SK, XiaoY et al. The balance between grain supply and demand and the reconstruction of China’s food security strategy in the new period. Journal of Natural Resources, 32, 895-903(2017).
[21] Xu ZR, Zhang YL, Cheng SK et al. Scientific basis and the strategy of sustainable development on the Tibetan Plateau. Science & Technology Review, 35, 108-114(2017).
[22] Xu ZY, Song ZW, Deng AX et al. Regional changes of production layout of main grain crops and their actuation factors during 1981-2008 in China. Journal of Nanjing Agricultural University, 36, 79-86(2013).
[23] Yang CY, Shen WS, Li HD. Response of grain yield in Tibet to climate and cropland change during 1985-2010. Transactions of the Chinese Society of Agricultural Engineering, 31, 261-269(2015).
[24] Zhang YL, Liu LS, Wang Z F et al. Spatial and temporal characteristics of land use and cover changes on the Tibetan Plateau. Chinese Science Bulletin, 64, 2865-2875(2019).
[25] Zheng HL, Fang SF, Liu CC et al. Dynamics of monthly vegetation activity and its responses to climate change on the Tibetan Plateau. Journal of Geo-information Science, 21, 201-214(2019).
[26] Zhou ZY, Gao MJ, Li QX et al. Estimation of the primary products demand in China based on the balanced diet. Chinese Journal of Agricultural Resources and Regional Planning, 36, 85-90(2015).


Set citation alerts for the article
Please enter your email address

© Copyright 2018-2021 | Chinese Laser Press. All Rights Reserved 沪ICP备15018463号-20