• Photonics Research
  • Vol. 7, Issue 4, 445 (2019)
Saeid Rostami, Alexander R. Albrecht, Azzurra Volpi, and Mansoor Sheik-Bahae*
Author Affiliations
  • Department of Physics and Astronomy, University of New Mexico, Albuquerque, New Mexico 87131, USA
  • show less
    DOI: 10.1364/PRJ.7.000445 Cite this Article Set citation alerts
    Saeid Rostami, Alexander R. Albrecht, Azzurra Volpi, Mansoor Sheik-Bahae. Observation of optical refrigeration in a holmium-doped crystal[J]. Photonics Research, 2019, 7(4): 445 Copy Citation Text show less
    (a) Anti-Stokes fluorescence cooling process in Ho3+ ions; (b) emission (red line) and absorption (blue line) spectra of 1% Ho:YLF crystal at T=300 K (λ=c/ν). The shaded region denotes the cooling tail (λ>λf=2015 nm). Emission spectrum is measured with a scanning optical spectrum analyzer under laser excitation at 1890 nm. The absorption spectrum is directly measured with an FTIR spectrometer under E‖c configuration (c is the optical axis).
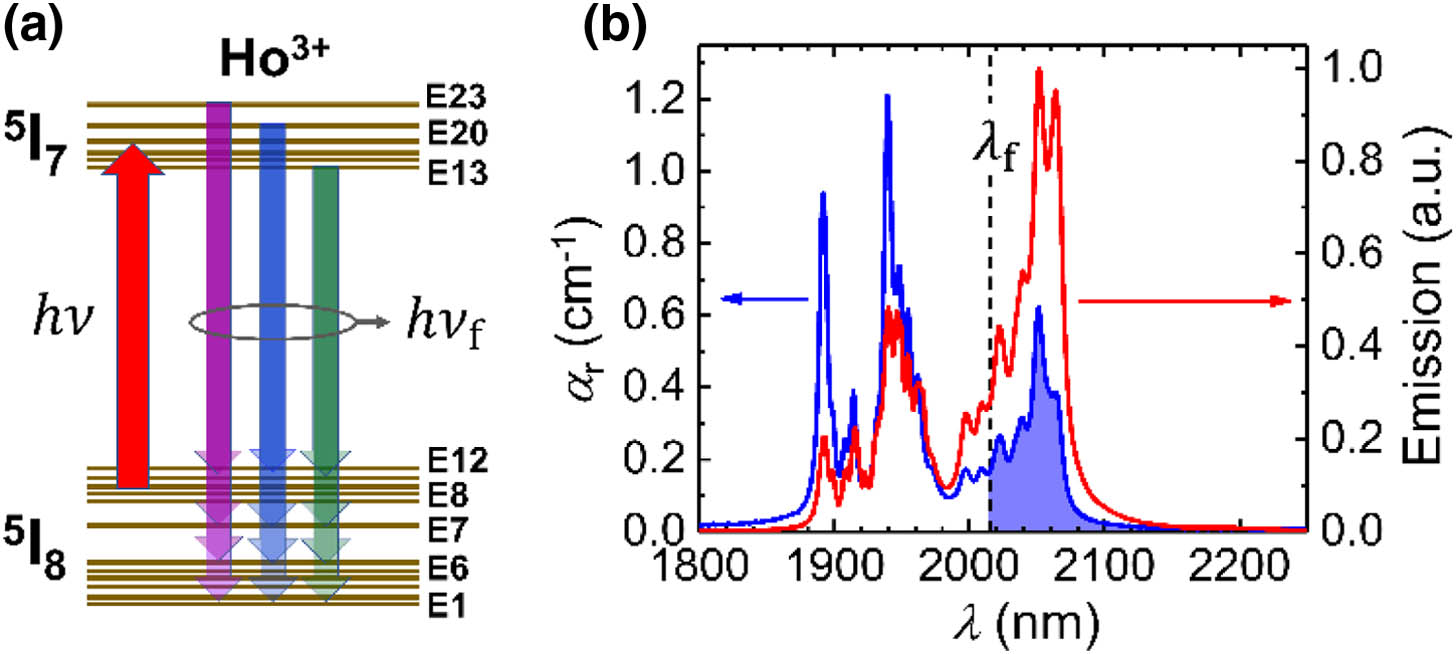
    Fig. 1. (a) Anti-Stokes fluorescence cooling process in Ho3+ ions; (b) emission (red line) and absorption (blue line) spectra of 1% Ho:YLF crystal at T=300  K (λ=c/ν). The shaded region denotes the cooling tail (λ>λf=2015  nm). Emission spectrum is measured with a scanning optical spectrum analyzer under laser excitation at 1890 nm. The absorption spectrum is directly measured with an FTIR spectrometer under Ec configuration (c is the optical axis).
    (a) Schematic of mid-IR laser cooling and LITMoS test setup for Ho-doped crystals. (b) LITMoS test result for 1% Ho:YLF crystal; the theoretical fit to the data, using Eq. (1), gives the external quantum efficiency (ηext) and the parasitic (background) absorption coefficient (αb). The insets show two thermal images corresponding to heating and cooling regimes.
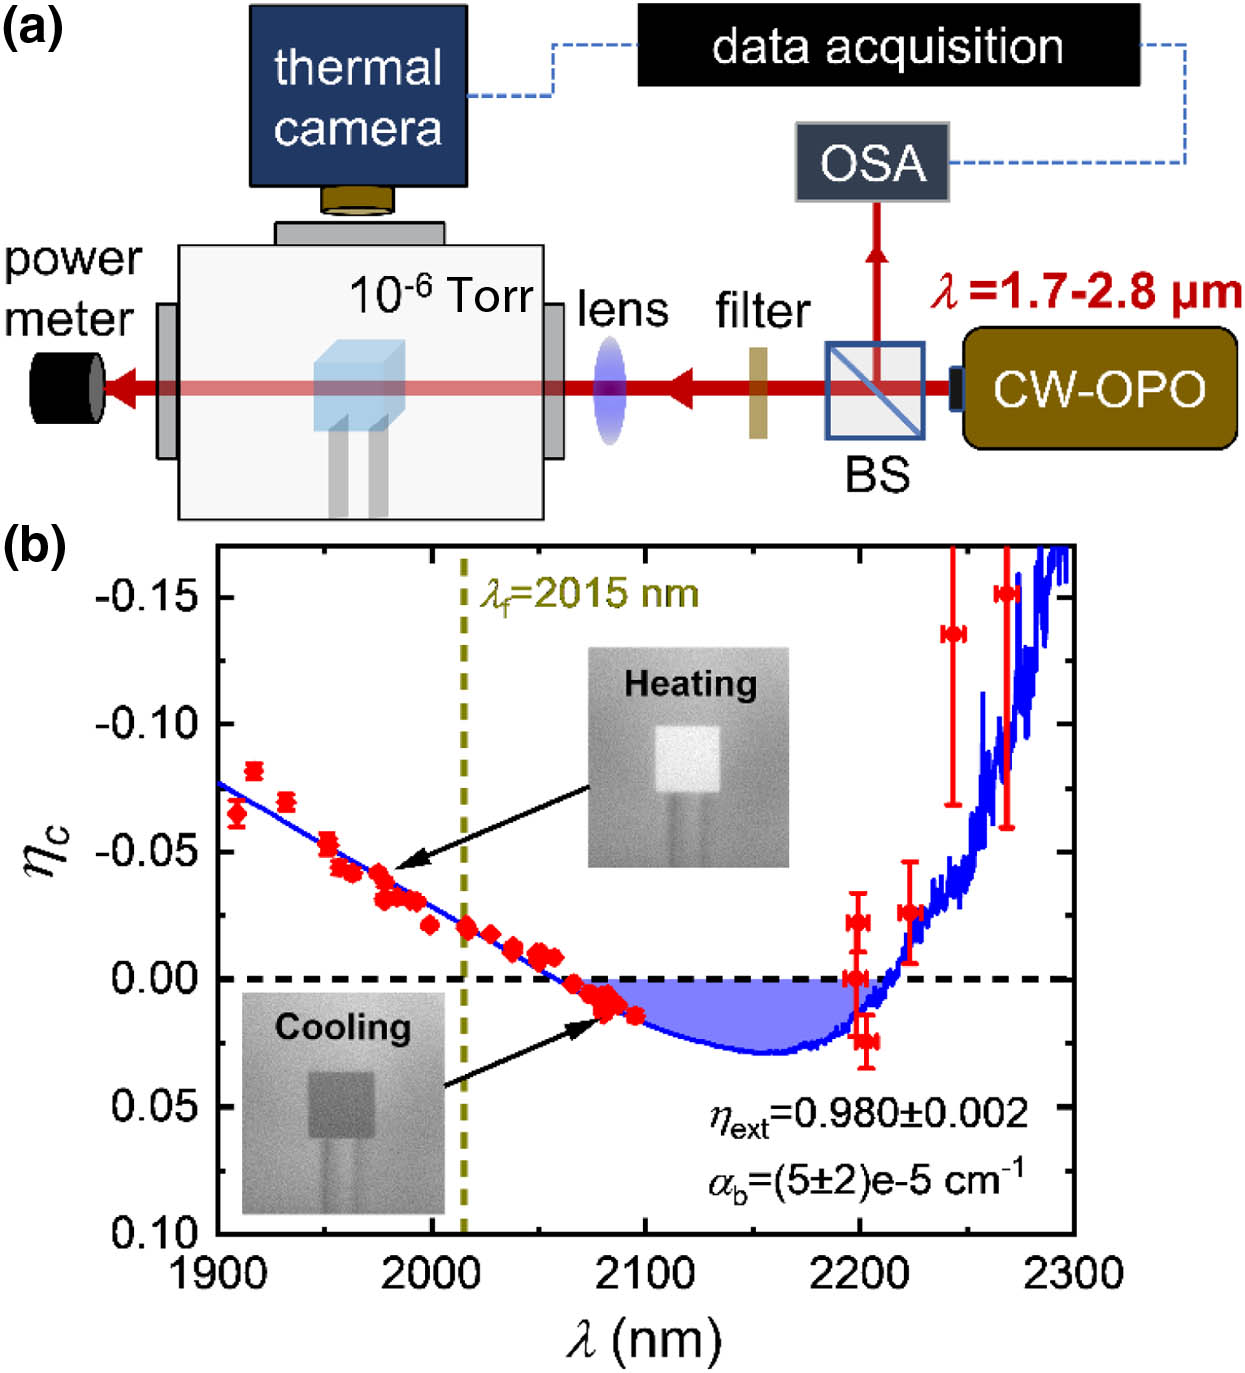
    Fig. 2. (a) Schematic of mid-IR laser cooling and LITMoS test setup for Ho-doped crystals. (b) LITMoS test result for 1% Ho:YLF crystal; the theoretical fit to the data, using Eq. (1), gives the external quantum efficiency (ηext) and the parasitic (background) absorption coefficient (αb). The insets show two thermal images corresponding to heating and cooling regimes.
    (a) Temperature dependence of the mean fluorescence wavelength (λf) for cooling grade 1% Ho:YLF and 1% Tm:YLF crystals. For comparison, data are normalized to room temperature values. (b) Temperature dependence of the resonant absorption coefficient of the I85–I75 transition in 1% Ho:YLF from 300 K to 80 K in 20 K steps (E‖c). (c) Cooling efficiency ηc(λ,T) versus excitation wavelength and crystal temperature. The blue and red regions correspond to the cooling (ηc>0) and heating (ηc<0) regimes, respectively, with the white transition line indicating the local minimum achievable temperature (MAT) at a given wavelength. The global MAT (as indicated by dashed lines) is ∼130±10 K at λ=2070±0.5 nm, which corresponds to the E12→E13 transition in Ho3+ (Ref. [21]). (d) Ratio of maximum cooling efficiency of the Ho:YLF sample over the optimal 10% Yb:YLF sample assuming various ηext and doping concentrations for Ho:YLF.
    Fig. 3. (a) Temperature dependence of the mean fluorescence wavelength (λf) for cooling grade 1% Ho:YLF and 1% Tm:YLF crystals. For comparison, data are normalized to room temperature values. (b) Temperature dependence of the resonant absorption coefficient of the I85I75 transition in 1% Ho:YLF from 300 K to 80 K in 20 K steps (Ec). (c) Cooling efficiency ηc(λ,T) versus excitation wavelength and crystal temperature. The blue and red regions correspond to the cooling (ηc>0) and heating (ηc<0) regimes, respectively, with the white transition line indicating the local minimum achievable temperature (MAT) at a given wavelength. The global MAT (as indicated by dashed lines) is 130±10  K at λ=2070±0.5  nm, which corresponds to the E12E13 transition in Ho3+ (Ref. [21]). (d) Ratio of maximum cooling efficiency of the Ho:YLF sample over the optimal 10% Yb:YLF sample assuming various ηext and doping concentrations for Ho:YLF.
    (a) Schematic of the CW-OPO design for mid-IR optical refrigeration in Tm- and Ho-doped crystals. (b) Phase-matching curve of the mid-IR CW-OPO. (c) Typical normalized narrow linewidth signal and idler spectra of the CW-OPO.
    Fig. 4. (a) Schematic of the CW-OPO design for mid-IR optical refrigeration in Tm- and Ho-doped crystals. (b) Phase-matching curve of the mid-IR CW-OPO. (c) Typical normalized narrow linewidth signal and idler spectra of the CW-OPO.
    Saeid Rostami, Alexander R. Albrecht, Azzurra Volpi, Mansoor Sheik-Bahae. Observation of optical refrigeration in a holmium-doped crystal[J]. Photonics Research, 2019, 7(4): 445
    Download Citation