
Qiang Xu, Shaotong Zhou, Kun-lun Wang, Siqun Zhang, Hongchun Cai, Xiao Ren, Pan Liu, Xian bin Huang, Li Zhao, Wenkang Zou. X-ray emission characteristics in magnetically driven plasma jet experiments on PTS facility[J]. Matter and Radiation at Extremes, 2020, 5(1): 014401
- Matter and Radiation at Extremes
- Vol. 5, Issue 1, 014401 (2020)
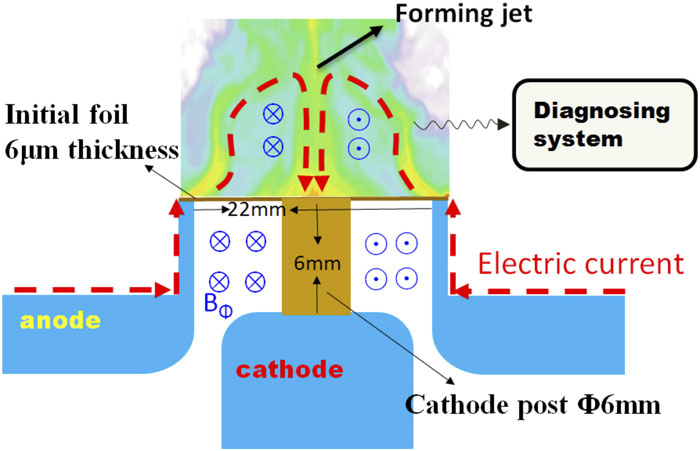
Fig. 1. Schematic of the load, showing the electrical current path, the magnetic field, and the structure of the electrodes.
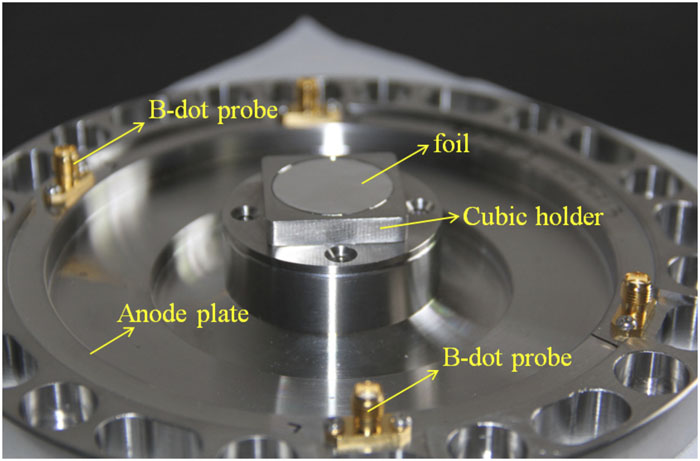
Fig. 2. Photograph of the actual load, with the foil, the cubic holder, the anode plate, and the B-dot probes.
Fig. 3. Schematic of the discharge chamber of PTS and the surrounding diagnostic instruments.
Fig. 4. Setup of the laser shadow imaging system.
Fig. 5. Dynamics and radiation characteristics of soft x-rays in shot 345 driven by a single post and aluminum foil. (a) Result from the laser shadow imaging system, which shows the foil behavior in the early stage. (b) Wave forms of electric current and x-ray power. The red region is the cathode post, the yellow dashed line indicates the initial foil position, and the red dashed line shows the result from the 0-D model.
Fig. 6. Dynamics and radiation characteristics of soft x-rays in shot 387 driven by a single post and copper foil. (a) Result from the laser shadow imaging system, which shows the foil behavior in the late stage. (b) Wave forms of electric current and x-ray power. (c) X-ray self-emission image. The red region is the cathode post, and the yellow dashed line indicates the initial foil position.
Fig. 7. Dynamics and radiation characteristics of soft x-rays in shot 390 driven by a single post and copper foil. (a) Result from the laser shadow imaging system, which shows the foil behavior in the late stage. (b) Wave forms of electric current and x-ray power. (c) X-ray self-emission image. Note that the bright area on the magnetic cavity in (a) may be caused by disturbance from another frame and can be ignored.
Fig. 8. Boundary positions and expansion velocities of magnetic cavities in shots 387 and 390. The filled and hollow circles denote axial and radial positions, respectively, in shot 387, and the solid and hollow squares denote axial and radial positions, respectively, in shot 390. The red and green symbols correspond to results from the x-ray framing pinhole camera and the laser shadow camera, respectively.
Fig. 9. Dose rates in shot 387 detected by each channel compared with the soft x-ray power. Note that the wave form of the soft x-ray here is the same as in Fig. 6(b) .
Fig. 10. Unfolded spectrum of hard x-rays in shot 387.
Fig. 11. Schematic of a possible radiation mechanism.
|
Table 1. Parameters of the filters in the Si-PIN array.

Set citation alerts for the article
Please enter your email address
© Copyright 2018-2021 | Chinese Laser Press. All Rights Reserved 沪ICP备15018463号-20