Jets are commonly observed astrophysical phenomena. To study the x-ray emission characteristics of jets, a series of radial foil Z-pinch experiments are carried out on the Primary Test Stand at the Institute of Fluid Physics, China Academy of Engineering Physics. In these experiments, x-ray emission ranging from the soft region (0.1–10 keV) to the hard region (10 keV–500 keV) is observed when the magnetic cavity breaks. The radiation flux of soft x-rays is measured by an x-ray diode and the dose rate of the hard x-rays by an Si-PIN detector. The experimental results indicate that the energy of the soft x-rays is several tens of kilojoules and that of the hard x-rays is ~200 J. The radiation mechanism of the x-ray emission is briefly analyzed. This analysis indicates that the x-ray energy and the plasma kinetic energy come from the magnetic energy when the magnetic cavity breaks. The soft x-rays are thought to be produced by bremsstrahlung of thermal electrons (~100 eV), and the hard x-rays by bremsstrahlung of super-hot electrons (~mega-electron-volt). These results may be helpful to explain the x-ray emission by the jets from young stellar objects.
I. INTRODUCTION
Jets are commonly observed astrophysical phenomena. There are many kinds of jets, including the most powerful jets emerging from active galactic nuclei (AGN),1 which have typical sizes ≥106 pc, velocities close to light speed, and sources with masses in the range 106–109M⊙, as well as jets from low-mass young stellar objects (YSOs) within our own galaxy, which have typical sizes ≤1 pc, velocities ≤10−3 pc, and parent protostars with masses of order 1 M⊙.2,3 Here, we focus on jets launched from YSOs (known as Herbig–Haro objects), because they can be well approximated as ideal, magnetized, compressible plasmas and simulated by laboratory experiments based on the scaling law proposed by Ryutov et al.4,5 At present, the mechanism of jet formation is still unclear. Some researchers believe that jet formation is a purely hydrodynamic process and have designed a number of scaled jet experiments on laser facilities to investigate the associated dynamics.6–11 However, others believe that YSO jets are driven by magnetic fields and that an originally poloidal magnetic field Bp is transformed by stellar rotation into a toroidal component Bϕ that accelerates and collimates the jet.12 Magneto hydrodynamic (MHD) simulations indicate that a radial foil or wire-array Z-pinch can provide a magnetic structure similar to that occurring in YSO jets.13 To validate these simulations, a series of radial wire-array and radial foil Z-pinch experiments have been carried out on pulsed-power generator facilities such as the Mega Ampere Generator for Plasma Implosion Experiments (MAGPIE) at Imperial College London,14–17 the Cornell Beam Research Accelerator (COBRA),18 and the Primary Test Stand (PTS) at the Institute of Fluid Physics, China Academy of Engineering Physics.19
Jet formation is a high-energy-density process and is always accompanied by intense x-ray emission and gamma-ray bursts, which have been observed by satellites.20,21 In particular, in recent decades, data from the ROSAT and Einstein surveys have suggested that YSOs show surprisingly hot x-ray emission, with fitted temperatures around 3 keV. Temperatures this high cannot be due to heating of stellar winds or to shock heating, but may result from magnetic activities in the jets.22,23 However, it is not easy to confirm such emission mechanisms, owing to the difficulty of obtaining sufficient spatial resolution in images of astrophysical jet. Recently, we have performed a series of jet experiments on the PTS using a radial metal foil Z-pinch. The aim of these experiments is to diagnose the dynamics of jets and their x-ray emission. A wide variety of x-ray emissions ranging from soft (0.1–10 keV) to hard (10 keV–1 MeV) have been found. In this paper, we attempt to elucidate the mechanism of x-ray emission by comparing the x-ray results with the jet dynamics. We hope our results will help to clarify the nature of the corresponding processes in astrophysical jets.
The remainder of the paper is organized as follows. In Sec. II, we introduce the experimental setup. In Sec. III, we present the experimental results on the dynamics and x-ray bursts. In Sec. IV, we discuss a possible mechanism for the x-ray emission. Finally, in Sec. V, we give our conclusions.
II. EXPERIMENTAL SETUP AND DIAGNOSTICS
A. Experiment setup
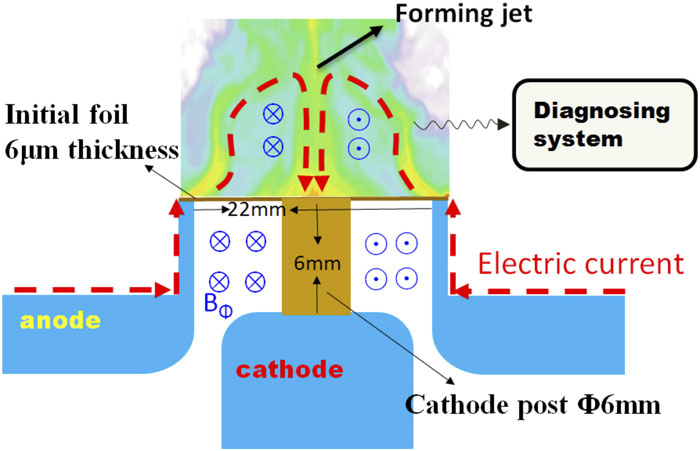
The experiments were performed on the PTS, which delivered a ∼7 MA, 180 ns current pulse from the generator to the load. The jet was produced from a radial metal foil with a single cathode post, as shown schematically in Fig. 1. We used both copper and aluminum foils. Such a load configuration allows the electrical current to flow radially along the foil, through the central post, and finally to the cathode. The foil of thickness 6 µm and diameter 22 mm was held on the anode by a cubic holder, as shown in Fig. 2, and was connected to the cathode by a solid stainless steel post of diameter 6 mm and height 6 mm.
Figure 1.Schematic of the load, showing the electrical current path, the magnetic field, and the structure of the electrodes.
Figure 1 also presents a simple illustration of the dynamics of the radial foil Z-pinch, which has been described in detail by Suzuki-Vidal et al.24 As the current starts to flow through the foil, the foil begins to ablate, and the ablation plasma is pushed upward by the J × B force. When all of the foil mass near the cathode post has been completely ablated, the toroidal magnetic field injected into the ablation plasma pushes the plasma outward and pinches the plasma on the axis, forming a jet.
B. Diagnostics
The diagnostic instruments surrounding the discharge chamber are shown schematically in Fig. 3. A laser shadow imaging system was mounted in the 150° and 330° directions. In this system, a frequency-doubled Nd:YAG laser (532 nm) provided 150 ps pulses, each with energy 120 mJ. The laser beam was designed to broaden initially and was then split into four beams (with ∼10 mJ per beam) by the splitting lens group, as shown in Fig. 4. The four laser beams passed through the plasma in turn at 6 ns intervals and were accepted by the imaging lens group and finally recorded by a CCD. Such a design can provide four frames of laser-shadow images per shot. This system can detect plasmas with electron number areal density ranging from 4 × 1016 cm−2 to 3.4 × 1020 cm−2 and can distinguish interfaces with electron number areal density gradient satisfying dne/dx > 1.7 × 1020 cm−3.
Figure 3.Schematic of the discharge chamber of PTS and the surrounding diagnostic instruments.
Soft x-ray (100 eV–5 keV) self-emission images were obtained by an x-ray framing pinhole camera,25 which was mounted in the 80° direction and was able to take eight pictures per experiment to observe the high-temperature region of the plasma. The pinhole aperture was 100 µm and the magnification was about 0.4, giving a spatial resolution of ∼380 µm. The temporal resolution was determined mainly by the exposure time, which was about 1 ns. The interframe time was set to 5 ns so that the system could cover a 40 ns temporal region per shot.
The x-ray power was measured by a flat x-ray diode,26 which was mounted in the 110° direction. The Au photocathode and Au filter used in this detector were carefully paired to ensure a near-flat spectral response up to 4 keV.
A six-channel Si-PIN detector with different filters was mounted in the 270° direction to acquire the dose rates of hard x-rays with different spectral responses. This system had a spectral response ranging from 10 keV to 500 keV.
The load electrical current was measured by four current magnetic B-dot probes mounted on the anode plate (Fig. 2). Before the formal experiment, the sensitivities of the probes were checked by a small test electrical current pulse to ensure that each probe was able to detect the total current path through the cathode post independently. In this paper, we take the mean of the results from the four probes as the experimentally determined electrical current.
III. EXPERIMENTAL RESULTS
In this section, we introduce the jet dynamics and the x-ray emission characteristics based on several diagnostic results, including laser shadow images, x-ray self-emission images, and wave forms of x-ray power and electric current. Several shots of the radial foil experiments were performed. Here, we select one aluminum foil experiment (shot 345) and two copper foil experiments (shots 387 and 390) to show the relationships between the dynamics and the x-ray emission characteristics.
A. Jet dynamics
The electric current wave forms shown in Figs. 5(b), 6(b), and 7(b) indicate that the current has a rise time of about 70 ns and a peak value of about 7 MA. The time is defined by the wave form of the current: the rising part of the electric current data (between 10% and 90% of the maximum current) is fitted by a straight line, and the intersection of this line with the time axis is taken to be the zero point (t = 0 ns).
Figure 5.Dynamics and radiation characteristics of soft x-rays in shot 345 driven by a single post and aluminum foil. (a) Result from the laser shadow imaging system, which shows the foil behavior in the early stage. (b) Wave forms of electric current and x-ray power. The red region is the cathode post, the yellow dashed line indicates the initial foil position, and the red dashed line shows the result from the 0-D model.
Figure 6.Dynamics and radiation characteristics of soft x-rays in shot 387 driven by a single post and copper foil. (a) Result from the laser shadow imaging system, which shows the foil behavior in the late stage. (b) Wave forms of electric current and x-ray power. (c) X-ray self-emission image. The red region is the cathode post, and the yellow dashed line indicates the initial foil position.
Figure 7.Dynamics and radiation characteristics of soft x-rays in shot 390 driven by a single post and copper foil. (a) Result from the laser shadow imaging system, which shows the foil behavior in the late stage. (b) Wave forms of electric current and x-ray power. (c) X-ray self-emission image. Note that the bright area on the magnetic cavity in (a) may be caused by disturbance from another frame and can be ignored.
The jet dynamics was recorded by the side-on laser shadow camera and the x-ray framing pinhole camera. Generally speaking, the dynamics of the jet in our experiment can be divided into three steps.
In step I, the foil begins to ablate and to be pushed upward by the J × B force when the electric current flows through it. This step can be observed in the aluminum foil experiment [see the laser shadow pictures in Fig. 5(a)]. If we assume that the foil retains the form of a thin shell at all times, then its motion can be described using the zero-dimensional (0-D) model given bywhere z(r, t) denotes the position of the foil at radius r and time t, I denotes the electric current, and ρ and δ denote the initial density and thickness of the foil, respectively. The result from the 0-D model can be compared with the experimental results. In Fig. 5(a), the dark regions in the laser shadow images represent the plasma regions where the areal electron number density is greater than 3.4 × 1020 cm−2. The results show that the boundaries of the dark regions extend beyond those predicted by the 0-D model. This indicates that the foil must have expanded into the plasma after the electric current had flowed through it, and some plasma must have been pushed up by the magnetic field as a precursor plasma.
In step II, the magnetic cavity begins to develop, and the toroidal magnetic field pinches the plasma on the axis, forming a precursor jet at the center. This precursor jet can be seen in the first two laser shadow camera images in Figs. 6(a) and 7(a), from shots 387 and 390, respectively. In both shots, the precursor jet seems to be strongly high collimated because it is composed of copper, which has a radiative cooling effect.29 The precursor jet has a diameter of 1–2 mm and a length of ∼10 mm. The formation of the magnetic cavity can be clearly seen in the first three x-ray pinhole camera images in Fig. 7(c), from shot 390. The expansion velocities of the magnetic cavity can be roughly estimated from the x-ray and laser shadow images. The axial and radial velocities measured in shots 387 and 390 are shown in Fig. 8, from which it can be seen that the axial and radial velocities of the magnetic cavity in shot 387 are 890 km/s and 436 km/s respectively, and those in shot 390 are 657 km/s and 226 km/s respectively. It seems that the velocities are much greater than those in our previous experiments driven by thick foils,19 as well as those in 1 MA experiments.17,24
Figure 8.Boundary positions and expansion velocities of magnetic cavities in shots 387 and 390. The filled and hollow circles denote axial and radial positions, respectively, in shot 387, and the solid and hollow squares denote axial and radial positions, respectively, in shot 390. The red and green symbols correspond to results from the x-ray framing pinhole camera and the laser shadow camera, respectively.
In step III, the magnetic cavity is broken, as can be seen from the last two images in Fig. 6(c) and the last three in Fig. 7(c). Here we cannot see the pinch at the center, because the plasma around the pinch is so dense that the laser cannot penetrate it.
The dynamics in our experiment is a little bit different from that in the 1 MA experiment described in Ref. 17, which shows several episodic magnetic cavities. We believe that this is because the 6 µm foil that we used is too thin and does not match well with the 7 MA generator. In the future, we may use a 10–30 µm foil, with the expectation that we will then observe an episodic magnetic cavity structure.
B. Soft x-ray emission
For shot 387, driven by copper foil, the x-ray power measured by the x-ray diode is shown in Fig. 6(b), from which it can be seen that the soft x-ray emission occurs from 60 ns to 90 ns and the peak power appears at 65 ns, which is called the peak time tpeak in the following. By integrating the soft x-ray power, we can get the energy of the soft x-rays, which is about 33 kJ.
The x-ray pinhole framing camera with a spectral range of 0.1–8 keV was used here to observe the region from which the soft x-rays are emitted. Figure 6(c) shows four x-ray images (60–80 ns) just around the time when the driving current reaches its maximum value. The x-ray image at 62 ns (3 ns before tpeak) shows much soft x-ray emission from the top of the magnetic cavity, where the magnetic field is going to break out. The x-ray image at 67.6 ns (2.6 ns after tpeak), which appears to be a little saturated, shows the magnetic cavity breaking, accompanied by substantial x-ray emission. The images at 73.9 ns and 78.5 ns show the situation after the cavity has broken.
Combining these three diagnostic results, we find two phenomena. First, the region from which the soft x-rays are emitted coincides with the region where the magnetic field breaks out: this can be seen from the similarity in shape of the luminous region in the x-ray image at 67.6 ns and the broken magnetic cavity in the laser shadow image at 69.5 ns, as well as from the similarity between the x-ray images at 73.9 ns and 78.5 ns and the laser shadow images at 75.5 ns. Second, the time of peak x-ray power coincides with the time at which the magnetic cavity breaks. On the basis of these two phenomena, we believe that the soft x-ray emission may result from the process of release of magnetic energy.
The two phenomena are verified by the result of shot 390, which was also driven by copper foil. In this shot, the peak power occurs at tpeak = 80.5 ns. Just 1.5 ns after tpeak, the x-ray framing pinhole camera obtains its brightest image, which shows that the magnetic cavity is breaking [see the fourth image in Fig. 7(c)]. In addition, 2.5 ns before tpeak, the details of breaking can also be observed in the laser shadow images [see the fourth image in Fig. 7(a)]. The first three images in Fig. 7(c) show the growth of the magnetic cavity. However, this cannot be seen in the laser shadow camera images at the corresponding times, and we believe that this is because the magnetic cavity may be buried in the background, through which the x-rays can penetrate but the laser beam cannot.
In our experiments, according to the results in Figs. 6(c) and 7(c), the soft x-rays seem to be emitted from the surface of the magnetic cavity. This is different from what happened in the 1 MA experiments,17,24 where a large amount of x-ray emission seemed to come from the central pinch. This may be because the foil we used was copper, which has a high opacity preventing the x-rays from penetrating through the surface plasma. Actually, we believe that both the central pinch plasma and the surface plasma of the magnetic cavity should emit x-rays, but they do so predominantly at different times. Before the breaking of the magnetic cavity, the x-rays from the pinch may be dominant owing to the higher electric current density and the work done by the J × B pinch force. At the time of breaking, as we will discuss in Sec. IV, most of the x-rays should come from the surface plasma, which will be heated by the high-energy electrons accelerated by the high inductive voltage. This means that each time we observe a peak in the x-ray power, there will be a voltage pulse. This phenomenon can also be found in the 1 MA experiments.17
C. Hard x-ray emission
The dose rate of hard x-rays was measured by the Si-PIN array which has six channels with six different filters. The parameters of these six filters are shown in Table I. The results for the hard x-rays in shot 387 are shown in Fig. 9, together with the waveform of soft x-ray power for comparison (the dose rate has been transformed to that at a distance of 1 m). The dose rates of different channels seem to decrease as the response photon energy range increases. It seems that the foil plasma emitted soft and hard x-rays simultaneously, since their wave forms are similar. This phenomenon indicates that the hard x-rays (10 keV–1 MeV) may also result from the breaking of the magnetic cavity. For the x-rays in the energy range above 10 keV, the dose rate reaches 8 × 10⁶ Gy/ns and the dose reaches 0.14 Gy. Taking the peak value of the dose rate in each channel and using a maximum-entropy-based spectrum unfolding method,27 we unfolded the spectrum of the hard x-rays, with the result shown in Fig. 10. The triangular shape of the spectrum is similar to that in a bremsstrahlung process where high-energy electrons are stopped by a metal wall, and it can be fitted by a straight line. The electron energy E0 can be estimated using Kramer’s formula28I(E) dE = kZ(E − E0). The electron energy in our experiments is found to be about 0.5 MeV. The total energy of hard x-rays can be estimated by integrating this spectrum, which gives a value of about 200 J.
Channel
1
2
3
4
5
6
Filter material
Al
Al
Al
Al
Cu
Fe
Thickness (mm)
1
2
4
8
1.1
20
Spectral response (keV)
>10
>15
>20
>25
>40
>150
Table 1. Parameters of the filters in the Si-PIN array.
Figure 9.Dose rates in shot 387 detected by each channel compared with the soft x-ray power. Note that the wave form of the soft x-ray here is the same as in Fig. 6(b).
IV. DISCUSSION OF A POSSIBLE MECHANISM OF X-RAY EMISSION
In this section, we investigate the mechanism of x-ray emission. To do this, we need to examine how the ∼mega-electron-volt electrons are generated and why the breaking of the magnetic cavity and the x-ray burst take place synchronously. First, we will see where the soft x-ray emission energy comes from. When the magnetic cavity breaks like the breaking of an electrical circuit, owing to the conservation of magnetic flux Φ, the magnetic field and the magnetic energy inside the cavity do not disappear at once, but rather the energy is transformed into other forms such as thermal energy, radiation energy, and kinetic energy. The electric current around the magnetic cavity also does not disappear immediately, but decreases to zero as the magnetic energy is dissipated on a time scale of several tens of nanoseconds (see Fig. 11). This process will result in a high voltage ε at the cutoff point. This voltage can accelerate electrons to mega-electron-volt energies. The high-energy electrons will interact with the plasma, with their energy being transformed into thermal energy and radiation energy. Here, the magnetic cavity in our experiment (see Fig. 11) can be thought of approximately as a coaxial line with inductance,where we take the outer radius R as ∼7 mm, the inner radius r0 as ∼1 mm, and the length h as ∼8 mm. The magnetic flux Φ = LI is dissipated in several tens of nanoseconds, resulting in a high voltagewhere we have taken the electric current as 7 MA and dt as 10 ns. Here, we have not used the electrical current data measured by the B-dot probes, which appear to remain constant. Those data represent the total currents that pass through the load, but not the local annular currents in the magnetic cavity. When the magnetic cavity breaks, the annular current in the cavity will be dissipated in several tens of nanoseconds (see the right-hand diagram in Fig. 11). The fact that the total current remains constant is not unexpected, since the current may reconnect beneath the magnetic cavity. We assume that the dissipation time of the local electrical current can be represented by the duration of the breaking, which we estimate to be several tens of nanoseconds.
Figure 11.Schematic of a possible radiation mechanism.
The magnetic energy inside the magnetic cavity will be partly transformed into kinetic energy in a P dV manner:where we have ignored the axial expansion velocity va and considered only the radial expansion velocity vr ∼ 200 km/s. Magnetic energy is also partly transformed into soft x-ray energy through thermal bremsstrahlung, whose power can be calculated asHere, Z0 is taken to be the atomic number of copper, the number densities ne and ni are assumed to be ne ∼ Zaveni ∼ 6 × 1020 cm−3, with the average degree of ionization given by , and the temperature Te and volume V are taken to be 100 eV and ∼1 cm3. On integrating this power over 10 ns, we get the energy of the soft x-rays as several tens of kilojoules, noticing that the experimental value is 33 kJ.
An mega-electron-volt electron moving in a dense plasma will be stopped by the plasma and emit hard x-rays. The radiation energy of the hard x-rays emitted per unit moving distance can be expressed aswhere Ee is the electron energy, re is the classical electron radius, and me is the electron mass. The number of high-energy electrons can be estimated from the electric current as nh = I dt/e. If we still take the number density of the plasma as ni ∼ 1 × 1020 cm−3 and take the moving distance as dx ∼ h ∼ 1 cm and the breaking duration of the cavity as dt ∼ 30 ns, we obtain the energy of the hard x-rays asnoticing that the experimental value is 200 J.
The mechanism proposed here is just one of many possible kinds. There may be some other mechanisms; for example, the hard x-rays may also come from the central pinch when the MHD instability of the pinch disturbs the current path. This will also provide spatial gaps to allow the acceleration of electrons. Confirmation of the mechanism requires further time- and space-resolved diagnosis of the hard x-rays. Actually, the theoretical calculations above are rather rough in nature, since the results are very sensitive to the number density and the temperature of the plasma, which are not diagnosed in our experiments. Here, however, we are more concerned about whether these theoretical results are of the same order of magnitude as the experimental values. Fortunately, we have found values of the plasma parameters for which the theoretical and experimental results match in order of magnitude, and these values appear to be reasonable. In the future, we may design a diagnostic system to verify this.
V. CONCLUSIONS
Jet experiments have been carried out on the PTS using a 6 μm-thick copper foil Z-pinch. An x-ray burst is observed when the jet evolves into the late stage and the magnetic cavity starts to break. The burst includes both soft x-rays (0.1–10 keV) with energy 33 kJ and hard x-rays (10 keV–1 MeV) with energy ∼200 J.
We have proposed a possible mechanism that explains how the soft and hard x-rays are produced. When the magnetic cavity breaks, a high voltage is produced and accelerates electrons to mega-electron-volt energies. These high-energy electrons produce hard x-rays. At the same time, soft x-rays are produced by bremsstrahlung of thermal electrons (∼100 eV). We believe that the energy of the x-rays and the plasma kinetic energy both come from the magnetic energy when the magnetic cavity breaks. However, we do not exclude some other possible mechanisms. We need more diagnostics to elucidate these mechanisms.
The discovery of these hard x-ray bursts and the associated mechanism are helpful in explaining the high-temperature x-ray emission from YSOs. At least, the experimental results here prove that the plasma can be heated by the magnetic activity in the jet itself. However, much effort is still needed to confirm this mechanism. In the next steps of our work, we intend to determine the exact region from which the hard x-rays are emitted and to construct a scaling law between the laboratory and astrophysical environments.
[7] P. L. Miller, P. E. Stry, L. M. Logory. Astrophysical jet experiments with colliding laser-produced plasmas. Astrophys. J., Suppl., 127, 423(2000).