• Acta Optica Sinica
  • Vol. 44, Issue 1, 0106027 (2024)
Zheyi Jin1, Meihua Bi1、2、*, Xuyang Teng1, and Miao Hu1
Author Affiliations
  • 1School of Communication Engineering, Hangzhou Dianzi University, Hangzhou 310018, Zhejiang, China
  • 2State Key Laboratory of Advanced Optical Communication Systems and Networks, Shanghai Jiao Tong University, Shanghai 200240, China
  • show less
    DOI: 10.3788/AOS231481 Cite this Article Set citation alerts
    Zheyi Jin, Meihua Bi, Xuyang Teng, Miao Hu. Design and Anti-Interference Analysis of Fault Monitoring System Based on Multi-Wavelength Grouping for Passive Optical Network System[J]. Acta Optica Sinica, 2024, 44(1): 0106027 Copy Citation Text show less
    Schematic diagram of multi-wavelength group-based fault detection scheme in PON system
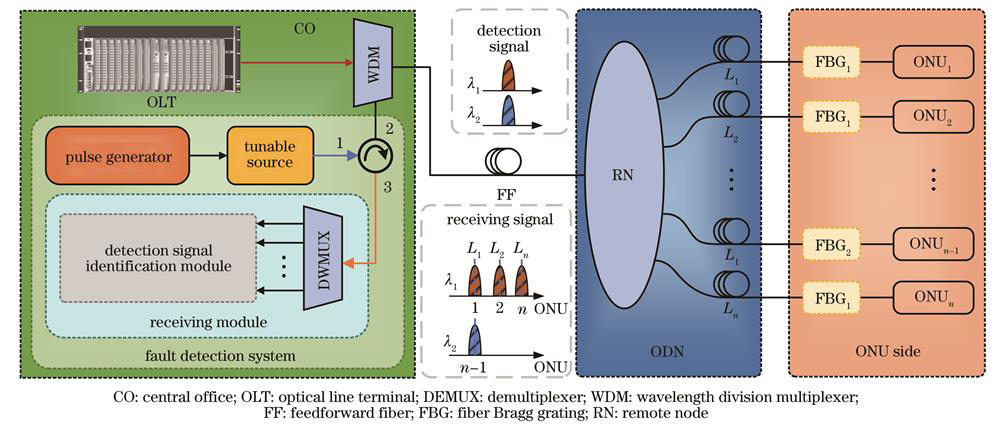
    Fig. 1. Schematic diagram of multi-wavelength group-based fault detection scheme in PON system
    PON system user distribution diagram and detection signal reception results. (a) Schematic diagram of distribution model; (b) arrival delay of single-wavelength detection signal; (c) arrival delay of multi-wavelength detection signal
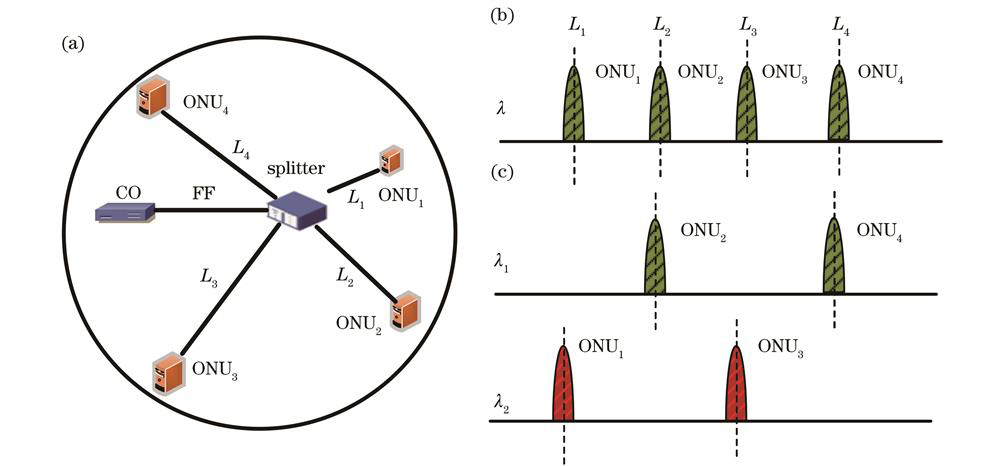
    Fig. 2. PON system user distribution diagram and detection signal reception results. (a) Schematic diagram of distribution model; (b) arrival delay of single-wavelength detection signal; (c) arrival delay of multi-wavelength detection signal
    Probability of interference under different wavelengths and number of ONU meets interference conditions. (a) Random grouping; (b) multi-wavelength grouping
    Fig. 3. Probability of interference under different wavelengths and number of ONU meets interference conditions. (a) Random grouping; (b) multi-wavelength grouping
    Simulation results of SNR under different detection pulse widths. (a) Relationship between noise component and detection pulse width; (b) relationship between SNR and pulse width
    Fig. 4. Simulation results of SNR under different detection pulse widths. (a) Relationship between noise component and detection pulse width; (b) relationship between SNR and pulse width
    Simulation results of SNR. (a) Relationship between SNR and detection pulse power; (b) relationship between SNR and the number of ONUs
    Fig. 5. Simulation results of SNR. (a) Relationship between SNR and detection pulse power; (b) relationship between SNR and the number of ONUs
    Simulation results of SIR. (a) Impact of number of ONUs on SIR; (b) impact of pulse width on SIR
    Fig. 6. Simulation results of SIR. (a) Impact of number of ONUs on SIR; (b) impact of pulse width on SIR
    Simulation of multi-wavelength group-based PON monitoring system. (a) Pulse signal response at the receiver end; (b) detection accuracy for ONU2
    Fig. 7. Simulation of multi-wavelength group-based PON monitoring system. (a) Pulse signal response at the receiver end; (b) detection accuracy for ONU2
    NameValue
    APD gain G100
    Total connector/splice loss αT /dB4
    Fiber attenuation for u band αa /(dB/km)0.3
    Laser linewidth Bo /MHz10
    β1/(BoTC
    APD excess noise power 12.97
    Power spectral density PTN /(A2/Hz)10-26
    Table 1. Performance simulation parameters of PON fault monitoring system
    Group IDWavelength of the detected signa λi /nmUser IDDistance lk /km
    G11610{ONU1,ONU2,ONU3,ONU4{15,19,23,26}
    G21620{ONU5,ONU6,ONU7,ONU8{18,22,27,31}
    G31630{ONU9,ONU10,ONU11,ONU12{21,25,31,36}
    G41640{ONU13,ONU14,ONU15,ONU16{24,29,35,42}
    Table 2. User grouping for PON fault monitoring system based on multi-wavelength grouping
    Zheyi Jin, Meihua Bi, Xuyang Teng, Miao Hu. Design and Anti-Interference Analysis of Fault Monitoring System Based on Multi-Wavelength Grouping for Passive Optical Network System[J]. Acta Optica Sinica, 2024, 44(1): 0106027
    Download Citation