
Qiang Sun, Lunan Dai, Kaining Ying, Chenyin Ni. Application of binary search and compressive sensing for rapid detection of defects inside laser ultrasound[J]. Infrared and Laser Engineering, 2022, 51(2): 20210810
- Infrared and Laser Engineering
- Vol. 51, Issue 2, 20210810 (2022)
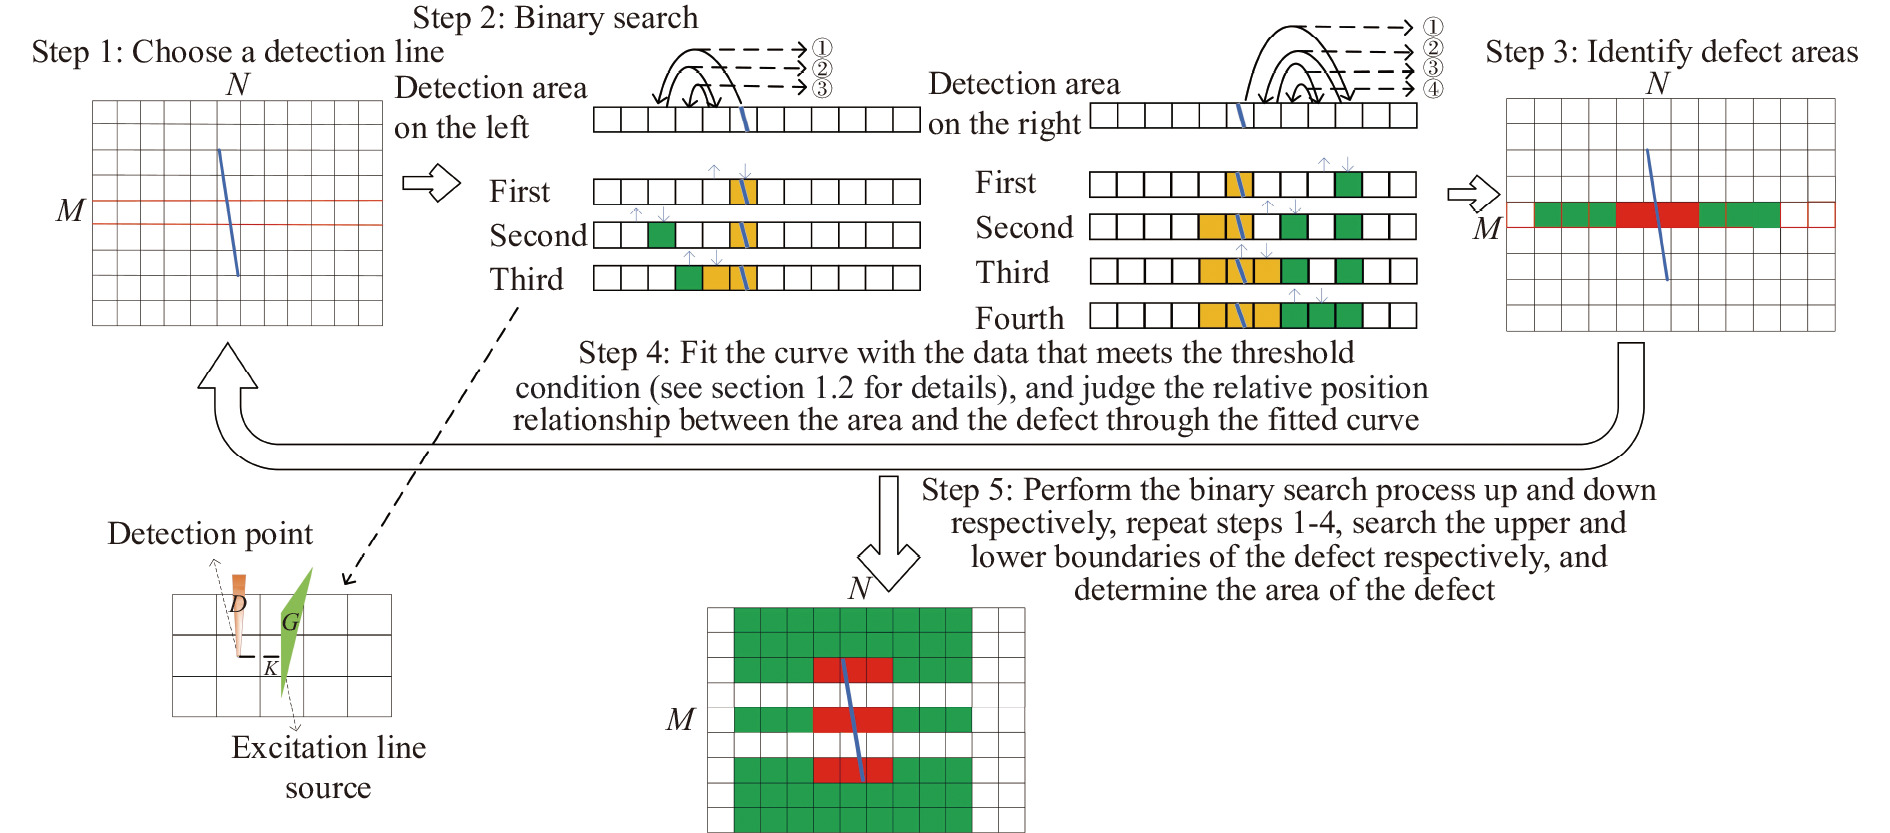
Fig. 1. Schematic diagram of binary search
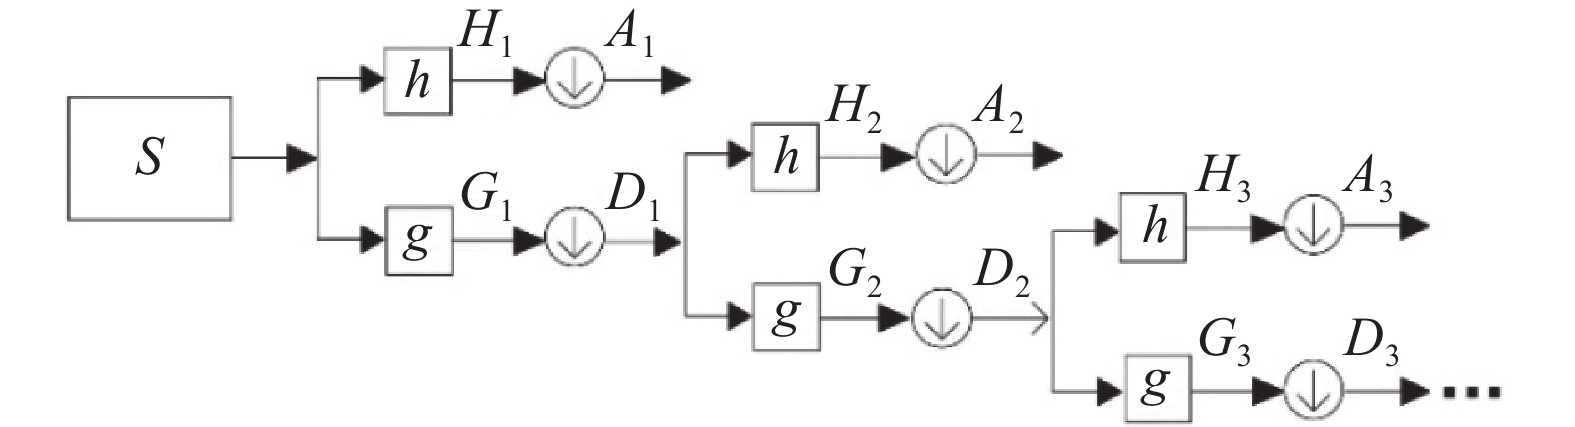
Fig. 2. Schematic diagram of wavelet transform
Fig. 3. Time domain signal diagram. (a) Measured ultrasonic signal; (b) Ultrasonic signal after wavelet transform
Fig. 4. Signal processing result diagram. (a) Wavelet transform result of a priori experiment; (b) Reconstructed signal containing defect reflection signal
Fig. 5. Schematic diagram of numerical simulation structure
Fig. 6. Signal processing result diagram. (a) Simulation result difference diagram; (b) Compressed sensing recognition signal result diagram
Fig. 7. Simulated binary search result diagram. (a) Binary search schematic diagram; (b) Curve fitting result diagram
Fig. 8. Detection system diagram. (a) Detection system schematic diagram; (b) Detection system device diagram
Fig. 9. Schematic diagram of defect search settings
Fig. 10. Experimental results. (a), (c), (e) show that the preset area is on the left, in the middle (including defects) and on the right; (b), (d), (f) is the corresponding curve fitting diagram
Fig. 11. B-sweep results with 1 mm scanning step
Fig. 12. B-sweep results with 0.1 mm scanning step
|
Table 1. Comparison of automatic and manual identification results for different wavelet bases(Unit: ns)

Set citation alerts for the article
Please enter your email address
© Copyright 2018-2021 | Chinese Laser Press. All Rights Reserved 沪ICP备15018463号-20