Liang-Qin CHEN, Ming-Xuan ZENG, Zhi-Meng XU, Zhi-Zhang CHEN. Head motion detection based on low resolution infrared array sensor[J]. Journal of Infrared and Millimeter Waves, 2023, 42(2): 276
Copy Citation Text
People easily get distracted or tired after long-duration actions such as driving and online classes, which can lead to accidents or poor efficiency. To detect such human behaviors, a head motion detection method based on low-resolution infrared array sensors is proposed with the protection of personal privacy. First, prominent areas of the human body are extracted based on image processing techniques. Then a 3D image fusion algorithm is developed to extract the change information in the spatiotemporal domain. Finally, an improved residual network is developed to achieve head motion classification. Ten head movements are designed for driving and online classroom scenarios. Experimental results show that in the detection range of 50 cm to 100 cm, our average recognition rate is 96.76%, and the processing speed is 9 frames per second, which is better than the existing state-of-the-art algorithms. The accuracy of the system is 93.7% when it is applied to the vehicle experiment.
Head motion detection is widely used in face recognition[1],human-computer interaction[2],surveillance systems[3],computer games[4],suspicious behavior detection[5],and public healthcare[6]. It can also be applied for user distraction detection,such as driving and online classes[7]. Studies by the National Highway Traffic Safety Administration(NHTSA)have shown that nearly 80% of vehicle crashes involve driver distractions in the 3 s before the crash. With the widespread adoption of online classroom teaching due to the COVID-19 pandemic,students’ involuntary distractions have significantly affected teaching effectiveness. Therefore,a system that can detect and warn users of distracted behaviors is necessary. Detecting and analyzing the user’s head motion is an important method to analyze the user’s distraction behavior.
One of the most popular methods of head motion detection is based on wearable devices. Han et al.[8]attached a three-axis MEMS magnetometer and a miniature magnet to the user's neck;Ruzaij et al.[9] used an accelerometer to record head tilt and attach it in the user's forehead;Wu et al.[10] place an integrated system of various sensors(accelerometers,gyroscopes,etc.)under the brim of a duck-tongue hat. There is also a visible camera-based approach to head motion detection. For high-resolution images,head motion detection can be solved by locating facial features(e.g.,eyebrows,nose,cheeks,etc.)[11]. It is also feasible to use skin tone hair segmentation [12] to determine head motion. For low-resolution images texture detection(e.g.,LVQ[13],etc.)can be performed to determine the direction of head motion.
However,wearable devices require a user to wear or carry the device all the time,which makes it inconvenient. Visible light cameras are not too restrictive to the user,but they raise concerns about privacy invasion,and these devices usually do not work in the dark environments. The infrared array sensor performs imaging by detecting the infrared radiation temperature of the target without contact,and it is not sensitive to light conditions. Low-resolution infrared sensors also have the advantage of protecting privacy. Therefore,infrared sensors have a wide application field,including gesture recognition[14],multi-person localization and trajectory tracking[15],sleep detection[16],fall detection[17],and so on. Recently,Chen et al.[18]used Panasonic Grid-eye’s 8×8 infrared array sensors to design a face orientation detection system that identifies five facing directions(left 45°/90°,right 45°/90°,and front)by an SVM classifier,achieving detection accuracies of 89.1%,95.3% and 95.1% at 0.6 m,1.2 m and 1.8 m respectively. It can be seen that when the detection distance is reduced to 60 cm,the recognition accuracy drops below 90%. The result shows that the detection algorithm is not suitable for short-distance application scenarios such as driving and online classes.
In this study,we propose a head motion detection system based on a low-pixel(32×32)infrared array sensor. It detects head motion at short distances ranging from 50 cm to 100 cm,where generally only the head and a small portion of the shoulders fall into view. Our algorithm implements distance adaptation,which is more suitable for application scenarios such as driving and online classrooms,where there is typically a small motion between the user’s head and a fixed sensor.
1 Infrared array sensor and detection system architecture
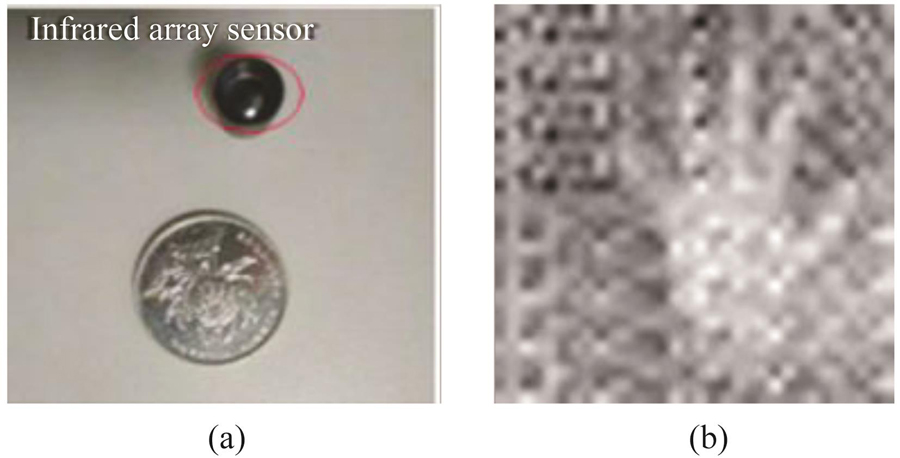
Our detection system is built with the HTPA32×32d(HEIMANN corporation)infrared array sensor,as shown in Fig. 1(a),and the parameters of the sensor are shown in Table 1. The 32×32 thermopile elements in the sensor detect the infrared radiation on the surface of the objects and convert it into temperature data output. The sensor’s operating temperature ranges from -40 °C to 85 °C,which means that the sensor works well under all common conditions. Figure 1(b)shows an example of the acquisition results of the sensor for the hand. As can be seen from the resulting image,the sensor only obtains the outline of the object,which protects the user’s privacy.
To build the head motion detection system,the infrared sensor is connected to the Raspberry Pi 3B through the I2C interface,and the collected temperature data is transmitted to the host computer through the WIFI module for final identification processing. For the application environment of driving and online classroom,the sensor is fixed in front of the user through a tripod,as shown in Fig. 2.
Figure 1.Infrared array sensor,(a)physical view of the sensor,(b)infrared temperature image(palm)
Our detection algorithm includes three modules:temperature image preprocessing,image fusion,and classification,as shown in Fig. 3. The image preprocessing module extracts the effective salient area of a human body from the low-resolution temperature image. The image fusion module obtains the final image by synthesizing the spatial domain image and the extracted temporal change information. The classification categorizes the final head motion types with the proposed Pro-ResNeXt50.
Figure 3.Flow chart of the head motion detection algorithm
2.2 Human salient region extraction at low resolution
There is noise interference in the data acquired by the IR array sensor. Figure 4(a)shows the original 32×32 image,which is presented as a pseudo-color image for a better view of the noise distribution,as shown in Fig. 4(b). The result interpolated to 64×64 is shown in Fig. 4(c). It can be seen that there is fixed temperature noise(marked by red circles)presents at the same location on each frame and random temperature noise(marked by black circles)at different locations at random. On the other hand,when the temperature differences between the human body and the background is small,and the temperature distribution of the human body area and the background area is inconsistent,the boundary between the two is complicated and blurred,as shown in Fig. 4(c). Therefore,correctly extracting salient human regions from low-resolution temperature data is a complex and critical issue.
Figure 4.Original image and pseudo-color image(the region of human head and shoulder)(a)origin image(32×32),(b)pseudo-color image(32×32),(c)pseudo-color image(64×64)
We propose a human salient region extraction method,as described in Fig. 5. First,we perform background removal on the raw temperature image to remove as much fixed noise from the sensor as possible(Fig. 5(b)). The background frame is obtained by averaging 5 consecutive frames of the environment with the non-human heat source. The small temperature difference and displacement between 5 or more consecutive background frames have little or no effect on the extraction of the human areas. The background frame is subtracted from the original temperature image,and then the guided filtering is further used to deal with the random noise. The results are shown in Fig. 5(c). Next,the Canny operator is used to detect the edge of the de-noised image. On this basis,the adaptive threshold method(subscribed in Algorithm 1)is further adapted to obtain a more continuous boundary,and the result is shown in Fig. 5(e). Finally,the complete human salient region is obtained through morphological processing including filling and erosion,and the final result are shown in Fig. 5(g). Taking Fig. 5(g)as the binary mask image,the human body region is extracted from the original temperature image,as shown in Fig. 5(h).
Algorithm 1Adaptive Threshold
Input: the image of Canny edge detection:
the local window size
1. Obtain the threshold(C)value by the OTSU method
We compare the extraction results of our algorithm with some classical methods such as OTSU,Prewitt operator,and Log operator,as shown in Fig. 6. The same background removal process is performed on the raw temperature data before applying these comparison algorithms for extraction. We select the three movements of bowing the head,making a phone call with the right hand,and turning the head 90° with the left for testing,and the corresponding collection distances are 50 cm,75 cm,and 100 cm,respectively. It can be seen that these classical algorithms can only extract part of the human body area,and some areas are separated. Our algorithm can obtain the complete and closed human body salient area. This provides the basis for subsequent 3D image fusion.
2.3 3D image fusion based on spatiotemporal synthesis
Our infrared sensor outputs data in the form of a sequence. The head movements are also continuous,such as bowing the head,raising the head,turning the head,etc. Therefore,each action’s information is reflected simultaneously in the current frame(spatial information)and multiple adjacent frames(temporal information). To this end,we design a 3D image fusion algorithm to synthesize the spatial and temporal information of each action,as shown in Eq. 1.
,
where as the 3D color image,fused by B channel CnB(x,y),G channel CnG(x,y)and R channel CnR(x,y). In(x,y) denotes the nth frame in the original temperature sequence image,and the subscript n represents the frame number of the sequence image;Bn(x,y) and Bn-1(x,y) denote the binary mask image at frame n and n-1 respectively obtained by the preprocessing method described in Sect. 2.2. Bref(x,y) represents the binary mask image corresponding to the image frame with the head in front. We use it as the reference frame since this orientation is the most common action in driving and online learning. CnB(x,y) represents the spatial information extracted from the current frame image by multiplying with the binary mask image;CnG(x,y) and CnR(x,y) represent the time information,which is obtained by extracting the difference between the binary mask image of the current frame and the reference image and the previous frame,respectively.
Figure 7 shows the processing results of a sequence of 9 frame images,including 5 head movements. The first row is the original temperature image,the second row is the mask image,the third row is the extracted spatial information frame,the fourth to fifth row is the time information frame,and the last row is the 3D image obtained by addition and fusion. Use 3D images as the input data for the later recognition model.
Design an improved model based on the residual network and call it Pro-ResNeXt50. Deep networks can theoretically achieve higher accuracy. However,as the depth of the network increases,the gradient will disappear or explode,and the accuracy will decline. Therefore,Dr. He proposed the deep residual network ResNet[19] to overcome the above problems. A residual model is developed to build directly connected channels,bypassing the input information directly to the output. It improves the network performance. There are five main forms of ResNet:ResNet18,ResNet34,ResNet50,ResNet101,and ResNet152. From ResNet50 onwards,the Bottleneck structure is used as the residual block,shown in Fig. 8(a). The residual block of ResNeXt50(Fig. 8(c))is a combination of the BottleNeck structure(Fig. 8(a))and the “split-transform-merge” structure of the Inception network(Fig. 8(b))shown in Fig. 8. The advantage of the block structure is that the accuracy is improved by a wider or deeper network while the FLOPs and the number of parameters are guaranteed.
Figure 8.Residual learning structure of ResNeXt network,(a)BottleNeck structure of ResNet network,(b)split-transform-merge structure of Inception network,(c)block structure of ResNeXt network
Our network is improved based on the ResNeXt50 and named Pro-ResNeXt50. Our improvement aims to allow the network to achieve higher accuracy at a faster speed. The Pro-ResNeXt50 network model is shown in Fig. 9. The Pro-ResNeXt50 has 50 layers,including 6 modules. After the preprocessing,image data whose size is 3×224×224(Fig. 9(a)),is put into the network. The first module is the first convolutional layer and the maximum pooling layer. The convolutional layer uses a convolutional kernel size of 3×7×7,which is with the stride of 2 and padding of 3. The channel is increased to 64 and the image is downscaled to 112×112. Then it is input to a 3×3 maximum pooling layer with the stride of 2 and padding of 3,the image features downsampled to 64×56×56 are obtained. The tensor is then fed into four convolutional groups to increase the model parameters and extract more features. The second to fifth modules consists of 4 ResNeXt-modules(Fig. 8(c)),all of which are made up of 3,3,5 and 3 ResNeXt Basic Block respectively. Each block has 32 cardinalities. The output sizes of the second to fifth submodules are 256×56×56,512×28×28,1024×14×14,and 2048×7×7,respectively. The last,averaging pooling is used between the residual blocks and the last convolution layer,and the output image size is a matrix of 2048x1x1. The following a 1×1 convolutional layer is used with an output of 10.
The feature maps of a CNN can be considered as features of the input image. As shown on the left of Fig. 9,there is the visualization of the feature maps of each layer of the input image(Fig. 9(a)). Conv1(Fig. 9(b))represents the first convolutional layer image of Pro-ResNeXt50,and Block1 to Block4(Fig. 9(c)-(f))represent the four ResNeXt-modules images of Pro-ResNeXt50. The low-level feature map extracts the contour of the object,while the top-level feature map focuses on the location feature of the object.
The number of block modules of each convolutional layer of the ResNeXt50 network is reduced from[3,4,6,3]to[3,3,5,3]. Then the last fully-connected layer is modified to a 1×1 convolutional layer so that the network becomes a fully convolutional network. We compared the parametric quantities and floating-point numbers of ResNet50,ResNeXt50,and Pro-ResNeXt50,as shown in Table 2. It can be seen that the number of parameters(#params)has been reduced,and the number of floating-point numbers(FLOPs)has been increased. It can also be seen in Fig. 10 that the training loss of inputting 3D images into the ResNet50,ResNeXt50,and Pro-ResNeXt50 networks leveled off at 90,40,and 40 epochs,respectively,with accuracies of 98.25%,98.60%,and 99.30% at the time of training. It proves that the improved Pro-ResNeXt50 network trains faster while preventing overfitting. It proves that the Pro-ResNeXt50 network has faster training speed,faster convergence and the highest accuracy while preventing overfitting
Figure 11.Experience scenarios(a)Experiments in an indoor hall,(b)Experiments in a car:Experiments were conducted in an indoor hall to simulate a driving and online learning environment,as shown in Fig. 11(a). The test user is sitting on a chair,and the sensor is fixed at the height of 1.2 m above the ground by a tripod so that it is aligned with the user’s front face. The collection distance ranges of 0.5 m to 1 m,and the collected lighting environment includes both day and night conditions.
For driving and online classroom scenarios,we designed 10 head movements,including(1)facing forward(Front),(2)bowing(Bow),(3)turning left 45 degrees(L45°),(4)turning left 90 degrees(L90°),(5)turning right 45 degrees(R45°),(6)turning right 90 degrees(R90°),(7)turning left with shoulders(TL),(8)turning right with shoulders(TR),(9)making phone calls with the left hand(CL)and(10)making phone calls with the right hand(CR). Among them,facing forward(Front)is considered to be a normal posture for concentrating on driving and listening to lectures,and the other 9 actions are considered to be distracting behaviors.
The temperature data acquired by the sensor is saved as a video file. When collecting data,we let the user perform 10 actions continuously. Our training and testing data are formed by extracting single-frame data from video files. When collecting training data,we asked the users to move their heads slower and hold for 6 seconds at the end of each movement. This way,the sensor can acquire enough data frames for each action. When collecting testing data,the users perform movements such as moving the head at a normal speed and keeping it for 2 sin the final state of each movement. The training data were done at three acquisition distances,including 50 cm,75 cm,and 100cm. In addition to 50 cm,75 cm and 100 cm,the collection distance of testing data also randomly added 60 cm,70 cm,80 cm and 90 cm. The test users consisted of three men and two women. About 960 frames of training data are collected for each action of the 5 users,and a total of 9 600 frames of training data are collected for 10 actions,where the dataset at night is 4 600 frames. About 1 900 frames of data are used as the test dataset,where the dataset at night is 800 frames.
We implement the proposed model in PyTorch. Adam is used as the optimizer,Relu is used as the activation function,and the learning rate is set as 0.000 1.
3.2 Results and analysis
3.2.1 Accuracy analysis of Pro-ResNeXt50
Use accuracy(Acc)as the performance evaluation method of algorithm,and its calculation formula is shown in the following formula:
,
where nidenotes the correctly identified samples,andN denotes the total number of samples tested. The classification results are shown in Fig. 12,and the comparison with other algorithms is also given in the figure. These comparison algorithms include Chen’s method [18],LBP+SVM method,HOG+SVM method,and ARF+SVM method. LBP+SVM method,HOG+SVM method,and ARF+SVM method are based on extracting HOG,LBP,and ARtificial Features(178-dimensional features such as shape,etc.)respectively,and then further obtain classification results through SVM. As can be seen from the figure,the recognition accuracy of our algorithm is the best,reaching 96.76%,which is much higher than the results of other algorithms.
We randomly selected an action sequence at a distance of 100 cm for testing,and the results are shown in Fig. 13. We find that recognition errors are more likely to occur in the transition frames of the two actions. For example,in the process of turning 90° to the right and returning to the front face through 45°,the two frames in between are classified into the wrong category. Similar problems exist in the transition process of other actions. However,the recognition accuracy of each action is still relatively high,which can meet the needs of most applications,as shown in Table 3.
First,tried to input the original temperature image directly into the network for training and recognition,and the accuracy was only 87.73%. Next,we introduced an attention mechanism(CBAM)[20] on the original ResNeXt50 network and then trained with the original temperature image,and its recognition accuracy was 94.47%. Finally,we tested the results of different channel combinations as input images on the proposed network Pro-ResNeXt50,and the recognition rates were 89.35%,92.06%,87.31%,and 96.76%,respectively. It can be seen from Table 4 that the recognition rate is the highest when the images synthesized with three channels are used as input data,which also shows that our image preprocessing and fusion are effective. Furthermore,it can be inferred that Channel(2)(the subtraction with the front face)is more helpful than Channel(3)(the inter-frame difference map).
3.2.3 Effect of different network model on accuracy
Compare the performance of different network models,and the results are shown in Table 5. The recognition accuracy of ResNet50 and ResNeXt50 was 94.10% and 94.83%,respectively. The processing frame rates are 7 and 8 frames per second,respectively. In comparison,our improved model Pro-ResNeXt50 has the highest recognition accuracy and processing speed.
Method
Accuracy
Times
ResNet50
94.10%
7f/s
ResNeXt50
94.83%
8f/s
Pro-ResNeXt50
96.76%
9f/s
Table 5. Accuracy and time using different network
3.2.4 Effect of different acquisition conditions on the accuracy
We further analyze the recognition accuracy of the model in different detection distances and light conditions,and the results are shown in Fig. 14. The red line in Fig. 14 shows the recognition accuracy at different test distances,including 50 cm,60 cm,70 cm,75 cm,80 cm,90 cm,and 100 cm. Among them,60 cm,70 cm,80 cm,and 90 cm are the detection distances we randomly set,which are not in the coverage of the training data,but their recognition accuracy remains above 91%. It shows that although our algorithm is based on training,it has better robustness to different distances and can be applied to more application scenarios. The blue line in Fig. 13 gives the recognition accuracy in the day and night conditions,respectively. It can be seen that our algorithm is effective in both day and night lighting environments,and even the detection accuracy at night is higher. Properties that are not affected by lighting are also the advantage of infrared temperature sensors compared to generally visible light sensors.
3.3 Experiment in the driving state of the car
To verify the recognition accuracy of the model in a real-world application,we further tested it in a car driving environment. The infrared array sensor is fixed above the vehicle dashboard through a bracket,facing the driver's face area,as shown in Fig. 11(b). The test was conducted at normal speed(40-60 km/h)on the campus road,passing through road areas such as big turns,speed bumps,direct sunlight and shade trees. For the common head movements and distractions during driving,we designed six types of movements such as front face(Front),low head(Bow),left head turn 90 degrees(L90°),right head turn 45 degrees(R45°),right hand answer phone(CR)and right turn(TR). Two men and one woman were recruited as drivers and asked to do each of the six head movements specified above while driving,and a total of 1,232 test samples were collected. We recognized the samples directly with the network model previously trained in the indoor simulation environment,and the average recognition accuracy was 93.7%,and the recognition results for each action are shown in Table 6. The recognition accuracy will be further improved if the model is first trained with the real measurement dataset inside the car.
Activity
Front
Bow
L90°
R45°
RC
RT
Average Acc
Total
267
184
205
195
189
192
—
Precision
0.948
0.902
0.942
0.910
0.963
0.958
0.937
Table 6. The Precision for each activity in the car
A head motion detection algorithm based on a low-resolution infrared array sensor is proposed,which can be applied to behavior monitoring and analysis in driving and online classroom learning. First,the sensor acquires the head temperature image with a resolution of 32×32. The extremely low resolution effectively protects the privacy of users but also poses challenges for action recognition. Therefore,we design a salient region extraction algorithm for low-resolution images to extract the head region. Further,a 3D image fusion algorithm is developed to fully extract spatiotemporal information of continuous head movements. Finally,we propose an improved network Pro-ResNeXt50 for the recognition of ten kinds of head movements. The experimental results show that our algorithm can achieve an average recognition accuracy of 96.76%,and can be adaptive for detection distances within 0.5 m to 1 m. The processing speed of 9 frames per second can meet the needs of real-time applications. Besides,the accuracy of the in-car experiment was 93.7%. In the future,we will focus on the recognition of movement transition stages,especially for some fast movements of the head and hands. In addition,the lightweight model is also a direction that can be further studied.
[17] Zhao-Jun WANG, Zhi-Meng XU, Liang-Qin CHEN. Research on human behaviour recognition system based on infrared array sensors. Infrared technology, 42, 7(2020).