• Laser & Optoelectronics Progress
  • Vol. 56, Issue 19, 192303 (2019)
Zhou Jing1, Jiajie Fan1、2、3、*, Wei Chen1、2, Jie Liu1, Weizi Wu1, and Yanjian Xiong2
Author Affiliations
  • 1College of Mechanical and Electrical Engineering, Hohai University, Changzhou, Jiangsu 213022, China
  • 2Changzhou Institute of Technology Research for Solid State Lighting, Changzhou, Jiangsu 213161, China
  • 3Department of Microelectronics, EEMCS Faculty, Delft University of Technology, Delft 2628, the Netherlands
  • show less
    DOI: 10.3788/LOP56.192303 Cite this Article Set citation alerts
    Zhou Jing, Jiajie Fan, Wei Chen, Jie Liu, Weizi Wu, Yanjian Xiong. Optimized Uniform Illumination Design of Ultraviolet LED Array Module Used in Light Purification[J]. Laser & Optoelectronics Progress, 2019, 56(19): 192303 Copy Citation Text show less
    UV light purification system structure
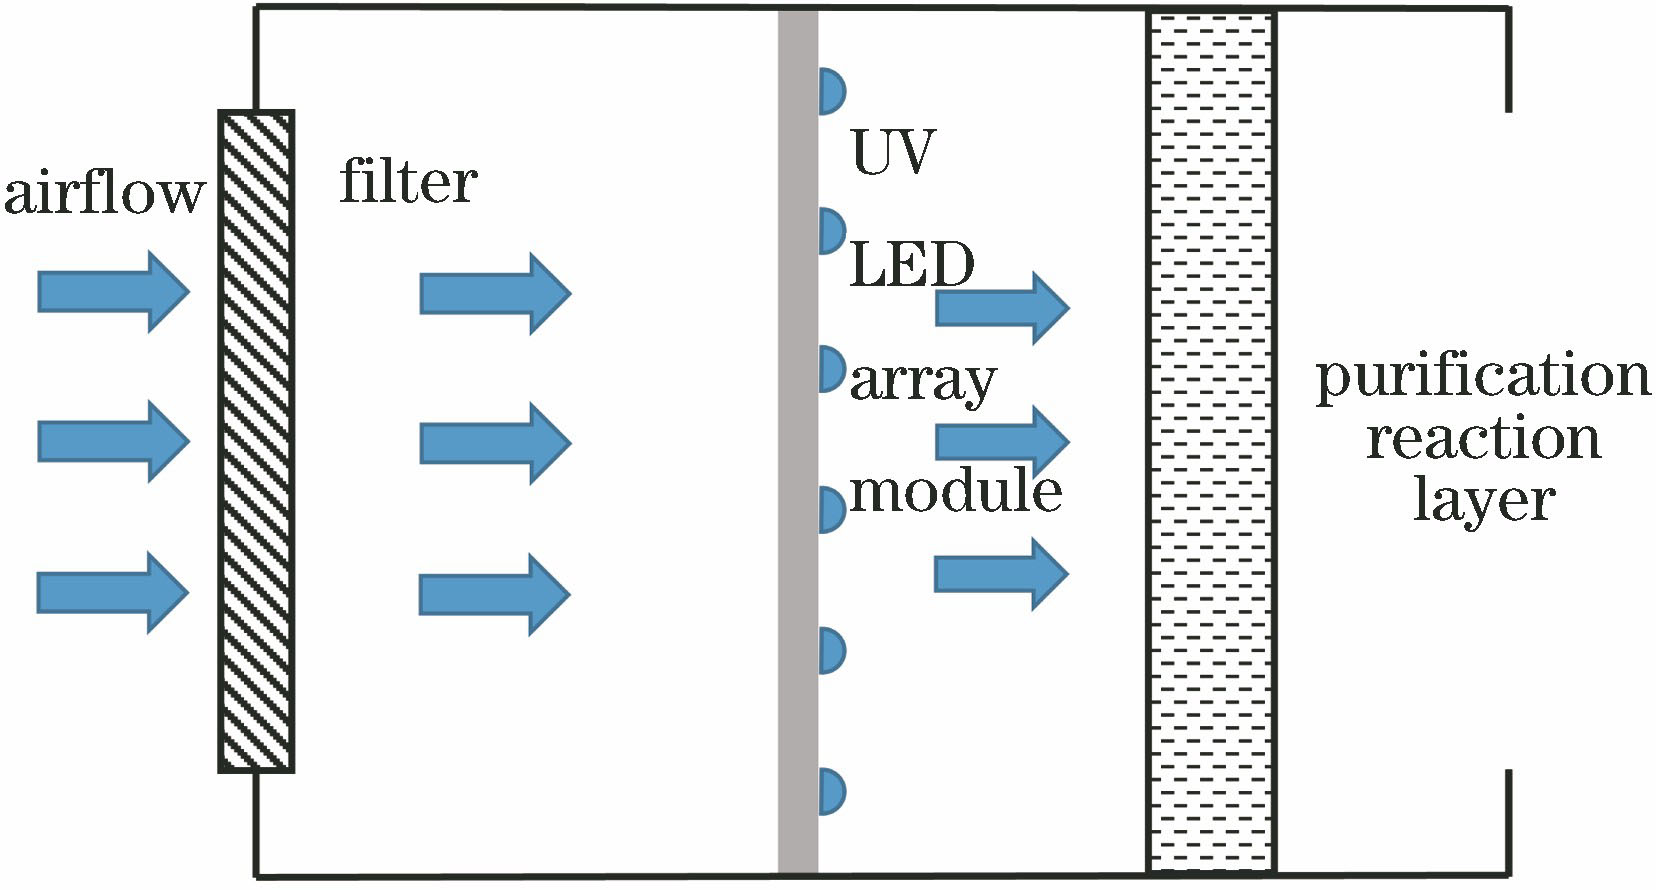
    Fig. 1. UV light purification system structure
    Structural diagram of UV LED array module. (a) 2D structure; (b) 3D structure
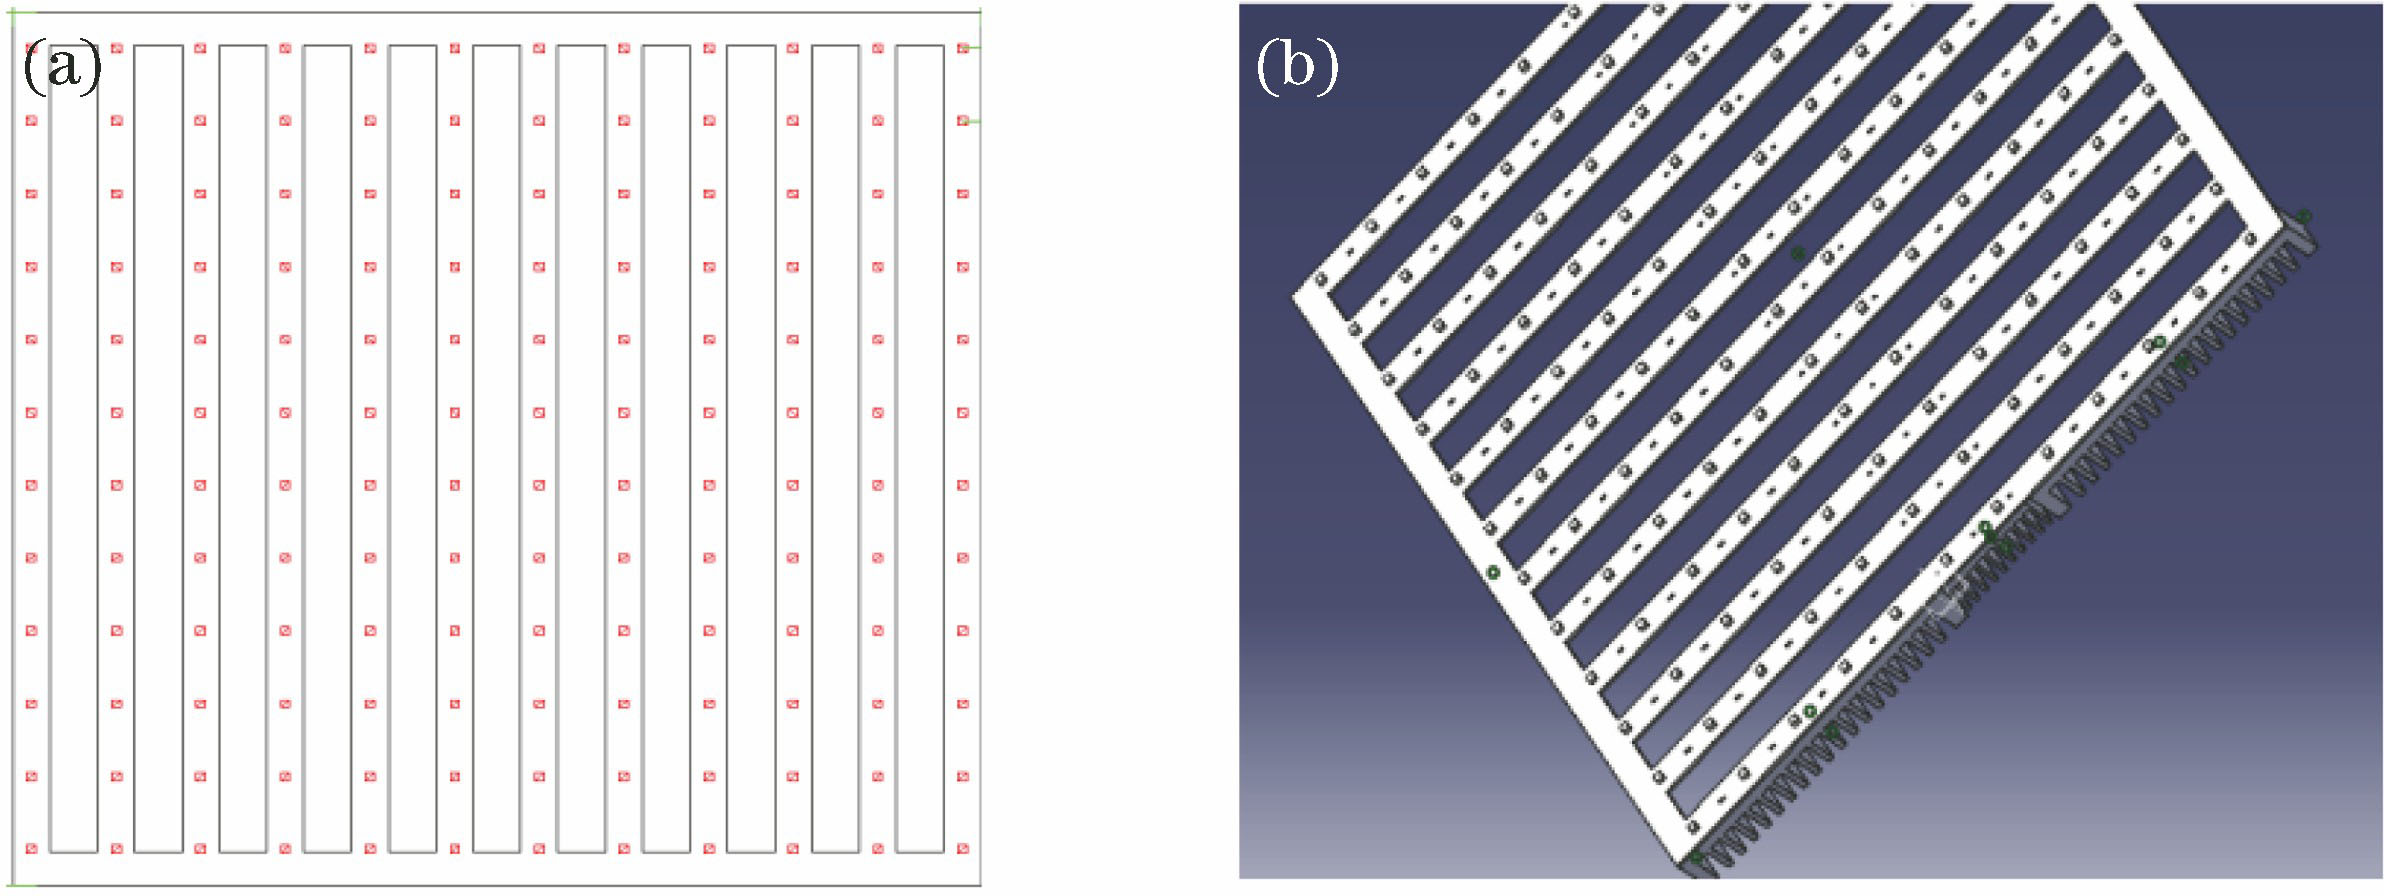
    Fig. 2. Structural diagram of UV LED array module. (a) 2D structure; (b) 3D structure
    Luminescence intensity distribution with three illumination angles
    Fig. 3. Luminescence intensity distribution with three illumination angles
    Influence of LED array on illumination at points A and B. (a) Point A; (b) point B
    Fig. 4. Influence of LED array on illumination at points A and B. (a) Point A; (b) point B
    Illumination of LED 1-3 at point A
    Fig. 5. Illumination of LED 1-3 at point A
    Illumination of LED 1-3 at point B
    Fig. 6. Illumination of LED 1-3 at point B
    Flowchart for calculating LED distance by the dichotomy method
    Fig. 7. Flowchart for calculating LED distance by the dichotomy method
    Simulated illumination distribution of UV LED array module when the irritation angle is 120° and illumination ratio of purification layer is 0.6
    Fig. 8. Simulated illumination distribution of UV LED array module when the irritation angle is 120° and illumination ratio of purification layer is 0.6
    Irradiance measurement setup for UV LED array module
    Fig. 9. Irradiance measurement setup for UV LED array module
    Experimental module and measuring points. (a) Picture of UV LED array module; (b) UV irradiance measuring points
    Fig. 10. Experimental module and measuring points. (a) Picture of UV LED array module; (b) UV irradiance measuring points
    Simulated illumination distributions of UV LED array module at different distances. (a) 20 mm; (b) 40 mm; (c) 60 mm; (d) 80 mm; (e) 100 mm
    Fig. 11. Simulated illumination distributions of UV LED array module at different distances. (a) 20 mm; (b) 40 mm; (c) 60 mm; (d) 80 mm; (e) 100 mm
    Comparison of experimental and simulation results of illumination uniformity on each target surface at different distances
    Fig. 12. Comparison of experimental and simulation results of illumination uniformity on each target surface at different distances
    h /mm2θ1/2 /(°)EB/EAd /mmArrangement of LEDs(LED module size: 330 mm×330 mm)Total number of LEDs
    201200.631.8811×11121
    0.7526.3213×13169
    0.917.3319×19361
    900.627.4112×12144
    600.7523.0614×14196
    0.915.7721×21441
    0.620.7916×16256
    0.7518.0018×18324
    0.913.3324×24576
    Table 1. LED distances calculated by the dichotomy method
    EB/EANormalized illumination on purificationlayer / LED emission illuminance
    2θ1/2 =120°2θ1/2 =90°2θ1/2 =60°
    0.60.840.930.96
    0.750.860.950.98
    0.90.890.920.98
    Table 2. Simulation results of normalized illumination distributions using the TracePro
    Package size /(mm×mm)Peakwavelength /nmPower(@0.35 A) /WOpticalpower /WThermal resistance /(℃·W-1)Beam angle /(°)
    3.5×3.53721.260.356120
    Table 3. Sample parameters of UV LED lamp bead used in this study
    PointIrradiance density /(102 μW·cm-2)
    h=20 mmh=40 mmh=60 mmh=80 mmh=100 mm
    VHVHVHVHVH
    Point-7126.52173.87113.96112.6269.5173.0865.1364.7341.6946.85
    Point-6179.02209.76148.36144.8580.2488.6978.5675.1554.6258.31
    Point-5215.79239.5181.06168.4294.84102.3688.3985.6663.9268.54
    Point-4241.6247.2194.87194.27110.19115.8298.3595.7170.0374.23
    Point-3242.1244.2211.33204.61123.11126.68105.62103.6175.6779.94
    Point-2245.4243.5217.57206.87131.21133.15111.59107.5579.6183.83
    Point-1240.7237.2217.92207.37137.93135.02114.45109.7281.8985.59
    Point0232.9230.7214.02202.12139.18134.69114.51108.5682.8785.54
    Point1226.8231.2207.57194.34137.03130.16111.26104.9780.4282.95
    Point2222.1217.9198.69182.14131.48119.56106.0798.0277.5379.30
    Point3212.7200.8181.14163.76121.27111.2198.4490.5772.7874.37
    Point4207.8184.47165.52146.68108.4699.6788.3279.4866.9765.83
    Point5196.9156.24140.83125.1795.7886.0678.3969.4260.4359.08
    Point6169.02129.14114.52102.4082.8370.0266.2059.1653.8351.57
    Point7139.74---70.2464.5254.7850.7938.9139.13
    Max245.4247.2217.92207.37139.18135.02114.51109.7282.8785.59
    Min207.8184.47165.52163.76108.4699.6788.3279.4866.9765.83
    Table 4. Irradiance density measurement results of target surfaces at different distances
    DistanceUniformity /%Average uniformity /%
    h=20 mmV84.7079.70
    H74.60
    h=40 mmV75.9077.50
    H79.00
    h=60 mmV77.9075.90
    H73.80
    h=80 mmV77.1074.80
    H72.40
    h=100 mmV80.8078.90
    H76.90
    Table 5. Calculated results of irradiance uniformity of target surfaces at different distances
    Distance h /mmVertical uniformityHorizontal uniformityAverage uniformity /%
    200.71/0.91≈0.780.74/0.95≈0.7878
    400.70/0.92≈0.760.74/0.96≈0.7777
    600.66/0.90≈0.730.71/0.92≈0.7775
    800.61/0.85≈0.720.59/0.79≈0.7573
    1000.64/0.86≈0.740.59/0.92≈0.6469
    Table 6. Simulated illumination uniformity of target surfaces at different distances
    Zhou Jing, Jiajie Fan, Wei Chen, Jie Liu, Weizi Wu, Yanjian Xiong. Optimized Uniform Illumination Design of Ultraviolet LED Array Module Used in Light Purification[J]. Laser & Optoelectronics Progress, 2019, 56(19): 192303
    Download Citation