• Chinese Physics B
  • Vol. 29, Issue 8, (2020)
Peng-Cheng Li1、2、† and Shih-I Chu3
Author Affiliations
  • 1Research Center for Advanced Optics and Photoelectronics, Department of Physics, College of Science, Shantou University, Shantou 55063, China
  • 2Key Laboratory of Intelligent Manufacturing Technology of MOE, Shantou University, Shantou 515063, China
  • 3Department of Chemistry, University of Kansas, Lawrence, Kansas 66045, USA
  • show less
    DOI: 10.1088/1674-1056/ab9c0f Cite this Article
    Peng-Cheng Li, Shih-I Chu. Multiphoton quantum dynamics of many-electron atomic and molecular systems in intense laser fields[J]. Chinese Physics B, 2020, 29(8): Copy Citation Text show less
    (a) Time-dependent ionization probability of 3s, 3p0, and 3p1 valence electrons of Ar atom in intense ultrashort laser fields with the laser peak intensity I = 8.0 × 10¹³ W/cm2. The laser wavelength is 800 nm, and the pulse length is 20 optical cycles with sin2 pulse shape. (b) Same as (a) for the laser peak intensity I = 3.0×10¹⁴ W/cm2.
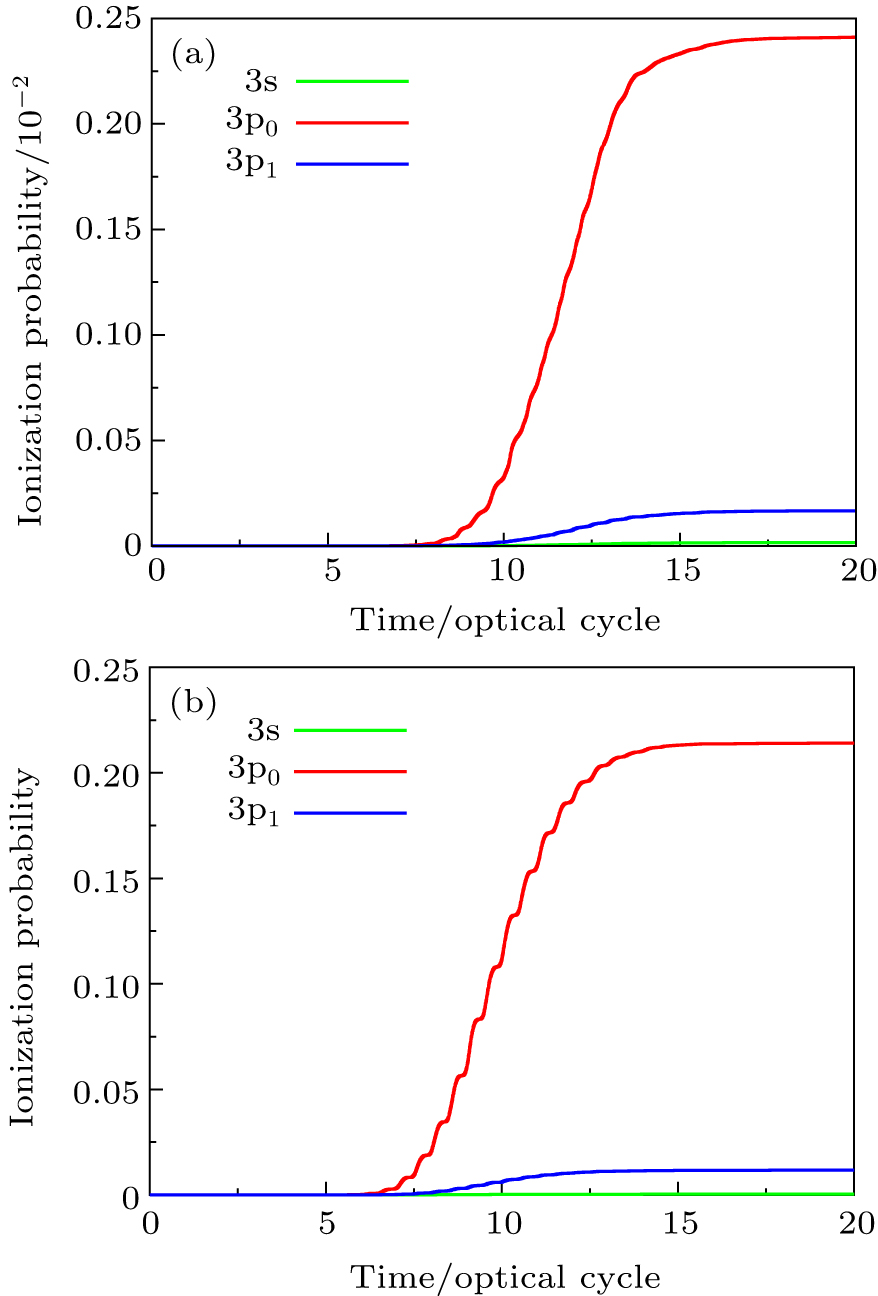
    Fig. 1. (a) Time-dependent ionization probability of 3s, 3p0, and 3p1 valence electrons of Ar atom in intense ultrashort laser fields with the laser peak intensity I = 8.0 × 10¹³ W/cm2. The laser wavelength is 800 nm, and the pulse length is 20 optical cycles with sin2 pulse shape. (b) Same as (a) for the laser peak intensity I = 3.0×10¹⁴ W/cm2.
    Time-dependent ionization probability of the different molecular orbitals electrons of N2 and CO in 800 nm, sin2 laser pulse with 20 optical cycles in pulse duration. (a) N2 molecule, for the peak intensity of laser field I = 8×10¹³ W/cm2. (b) CO molecule, for the laser peak intensity I = 5.0×10¹³ W/cm2.
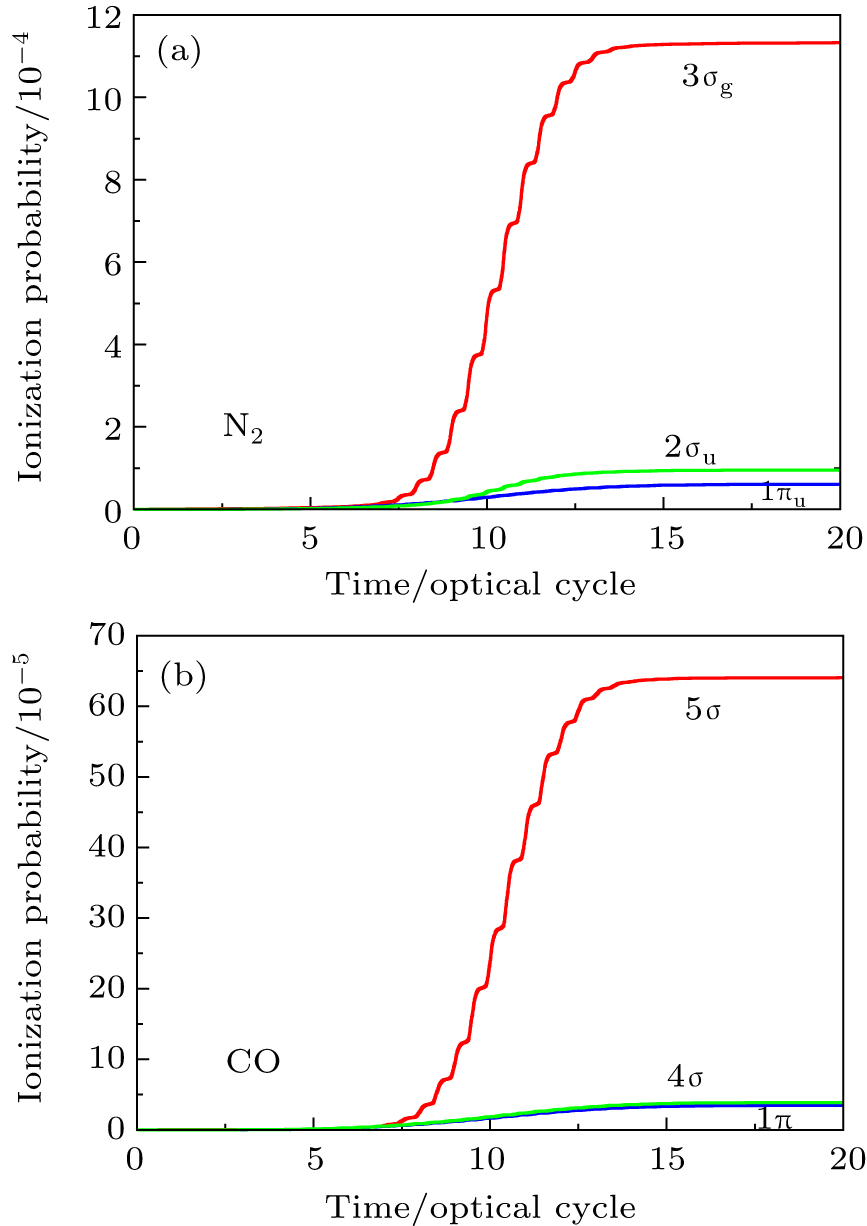
    Fig. 2. Time-dependent ionization probability of the different molecular orbitals electrons of N2 and CO in 800 nm, sin2 laser pulse with 20 optical cycles in pulse duration. (a) N2 molecule, for the peak intensity of laser field I = 8×10¹³ W/cm2. (b) CO molecule, for the laser peak intensity I = 5.0×10¹³ W/cm2.
    The orientation-dependent MPI probabilities for N2 molecule and Ar atom at the peak intensity (a) I = 1×10¹⁴ W/cm2 and (b) I = 5×10¹⁴ W/cm2.
    Fig. 3. The orientation-dependent MPI probabilities for N2 molecule and Ar atom at the peak intensity (a) I = 1×10¹⁴ W/cm2 and (b) I = 5×10¹⁴ W/cm2.
    The p-state photoelectron-momentum-distribution cross section of (a) Ne and (b) Ar driven by the 800-nm, linearly polarized, 20-cycle laser pulse along the z axis with a peak intensity of I = 1.0×10¹⁴ W/cm2.
    Fig. 4. The p-state photoelectron-momentum-distribution cross section of (a) Ne and (b) Ar driven by the 800-nm, linearly polarized, 20-cycle laser pulse along the z axis with a peak intensity of I = 1.0×10¹⁴ W/cm2.
    (a) Resonance-enhanced structures of the HHG from He as a function of the laser intensity and the photon energy in the single atom response. (b) Same as (a) but for I = 7.0×10¹³ W/cm2, I = 8.0×10¹³ W/cm2, and I = 9.0×10¹³ W/cm2, respectively. The black dashed lines in (a) and (b) indicate the transition energy of the 1s2-1s2p1P (21.22 eV), and the black solid lines indicate ionization potential Ip.
    Fig. 5. (a) Resonance-enhanced structures of the HHG from He as a function of the laser intensity and the photon energy in the single atom response. (b) Same as (a) but for I = 7.0×10¹³ W/cm2, I = 8.0×10¹³ W/cm2, and I = 9.0×10¹³ W/cm2, respectively. The black dashed lines in (a) and (b) indicate the transition energy of the 1s2-1s2p1P (21.22 eV), and the black solid lines indicate ionization potential Ip.
    (a) Phase-matching of resonance-enhanced structures from Ar atom simulated by the TDDFT/OEP-SIC in a 730-nm laser field. The shift of the phase-matched RESs relative to the bound state energies is indicated in the inset. The laser peak intensity in the center of gas jet is I = 3.0×10¹³ W/cm2, the confocal parameter of the laser beam is 35 mm, the length of gas jet is 2.0 mm, the pressure is 40 Torr, and the target is set at the laser focus –2 mm. (b) Same as (a) for the 60 Torr pressure.
    Fig. 6. (a) Phase-matching of resonance-enhanced structures from Ar atom simulated by the TDDFT/OEP-SIC in a 730-nm laser field. The shift of the phase-matched RESs relative to the bound state energies is indicated in the inset. The laser peak intensity in the center of gas jet is I = 3.0×10¹³ W/cm2, the confocal parameter of the laser beam is 35 mm, the length of gas jet is 2.0 mm, the pressure is 40 Torr, and the target is set at the laser focus –2 mm. (b) Same as (a) for the 60 Torr pressure.
    (a) and (c) Evolution of harmonic intensities in space for the 7th order harmonic (7H) and the 15th order harmonic (15H) of H2 molecules obtained from the mac TDDFT in an 800-nm laser field. The laser peak intensity in the center of gas jet is I = 8.0×10¹³ W/cm2, the pulse length is 20 optical cycles with cos2 pulse shape. (b) and (d) The corresponding phase difference of the HHG.
    Fig. 7. (a) and (c) Evolution of harmonic intensities in space for the 7th order harmonic (7H) and the 15th order harmonic (15H) of H2 molecules obtained from the mac TDDFT in an 800-nm laser field. The laser peak intensity in the center of gas jet is I = 8.0×10¹³ W/cm2, the pulse length is 20 optical cycles with cos2 pulse shape. (b) and (d) The corresponding phase difference of the HHG.
    A scheme of dual-gas QPM
    Fig. 8. A scheme of dual-gas QPM
    Enhancement of the HHG in dual-gas QPM. For the reference, the corresponding one-gas result (blue dotted lines) is presented.
    Fig. 9. Enhancement of the HHG in dual-gas QPM. For the reference, the corresponding one-gas result (blue dotted lines) is presented.
    (a) High-order harmonic spectra of He atoms driven by two color combined laser field with the proper time delay td. (b) Attosecond pulse generation by superposing hundreds of the harmonics shown in (a).
    Fig. 10. (a) High-order harmonic spectra of He atoms driven by two color combined laser field with the proper time delay td. (b) Attosecond pulse generation by superposing hundreds of the harmonics shown in (a).
    StateEnergy/a.u.
    g−1.1026342144949464615089689a
    −1.1026342144949b
    u−0.6675343922023829303619702a
    −0.6675343922024b
    1πu−0.4287718198958564363139601a
    −0.4287718198959b
    g−0.3608648753395038450386998a
    −0.3608648753383b
    u−0.2554131650864845614172502a
    −0.2554131650857b
    Table 1. High-precision bound state energies of H2+ at internuclear separation 2 a.u.
    lαrcSNA1A2B1B2
    00.281252.0−7.90939121−10.8996640.01.73.8
    10.281252.01.5009497010.112976840.01.33.8
    20.281252.00.882947661−0.0320430290.01.33.8
    30.281252.00.411931101−0.1293911800.01.33.8
    ≥30.281252.00.010.00.01.30.0
    Table 2. Model potential parameters for He (in a.u.).
    nEnergy En,l
    l = 0l = 1l = 2l = 3
    1−0.90369
    −0.90356
    2−0.14589−0.12384
    −0.14595−0.12382
    3−0.06152−0.05515−0.05562
    −0.06126−0.05513−0.05556
    4−0.03372−0.03107−0.03128−0.03125
    −0.03358−0.03125−0.03127−0.03125
    5−0.02125−0.01990−0.02001−0.02000
    −0.02117−0.01990−0.02001−0.02000
    6−0.01461−0.01383−0.01390−0.01389
    −0.01456−0.01383−0.01389−0.01388
    Table 3. Comparison of the calculated He atomic energies with the experimental values (in a.u.). For each angular momentum l, two rows of energies En,l are listed: the upper row refers to the calculated model-potential energies, and the lower row refers the experimental values.[NIST]
    Peng-Cheng Li, Shih-I Chu. Multiphoton quantum dynamics of many-electron atomic and molecular systems in intense laser fields[J]. Chinese Physics B, 2020, 29(8):
    Download Citation