• Acta Optica Sinica
  • Vol. 41, Issue 17, 1712002 (2021)
Ran Zhao1、2、*, Zhiwei Hong3, Jing Lu3, Yang Zhang1、2、4, Yong Sun1、2, Yonggang Huang1, and Jinsheng Jia1、4
Author Affiliations
  • 1State Key Laboratory of Green Building Materials, China Building Materials Academy, Beijing 100024, China
  • 2Beijing Key Laboratory of Solar Energy and Building Energy-Saving Glass Materials Processing Technology, Beijing 100024, China
  • 3Zhongkexin Engineering Consulting (Beijing) Co., Ltd., Beijing 100039, China
  • 4CNBM Guangxin Technology Co., Ltd, Zaozhuang, Shandong 277100, China
  • show less
    DOI: 10.3788/AOS202141.1712002 Cite this Article Set citation alerts
    Ran Zhao, Zhiwei Hong, Jing Lu, Yang Zhang, Yong Sun, Yonggang Huang, Jinsheng Jia. A New Method of Out-of-Plane Displacement Measurement for Optical Fiber Material Based on Digital Speckle Correlation Method[J]. Acta Optica Sinica, 2021, 41(17): 1712002 Copy Citation Text show less
    Wedged model
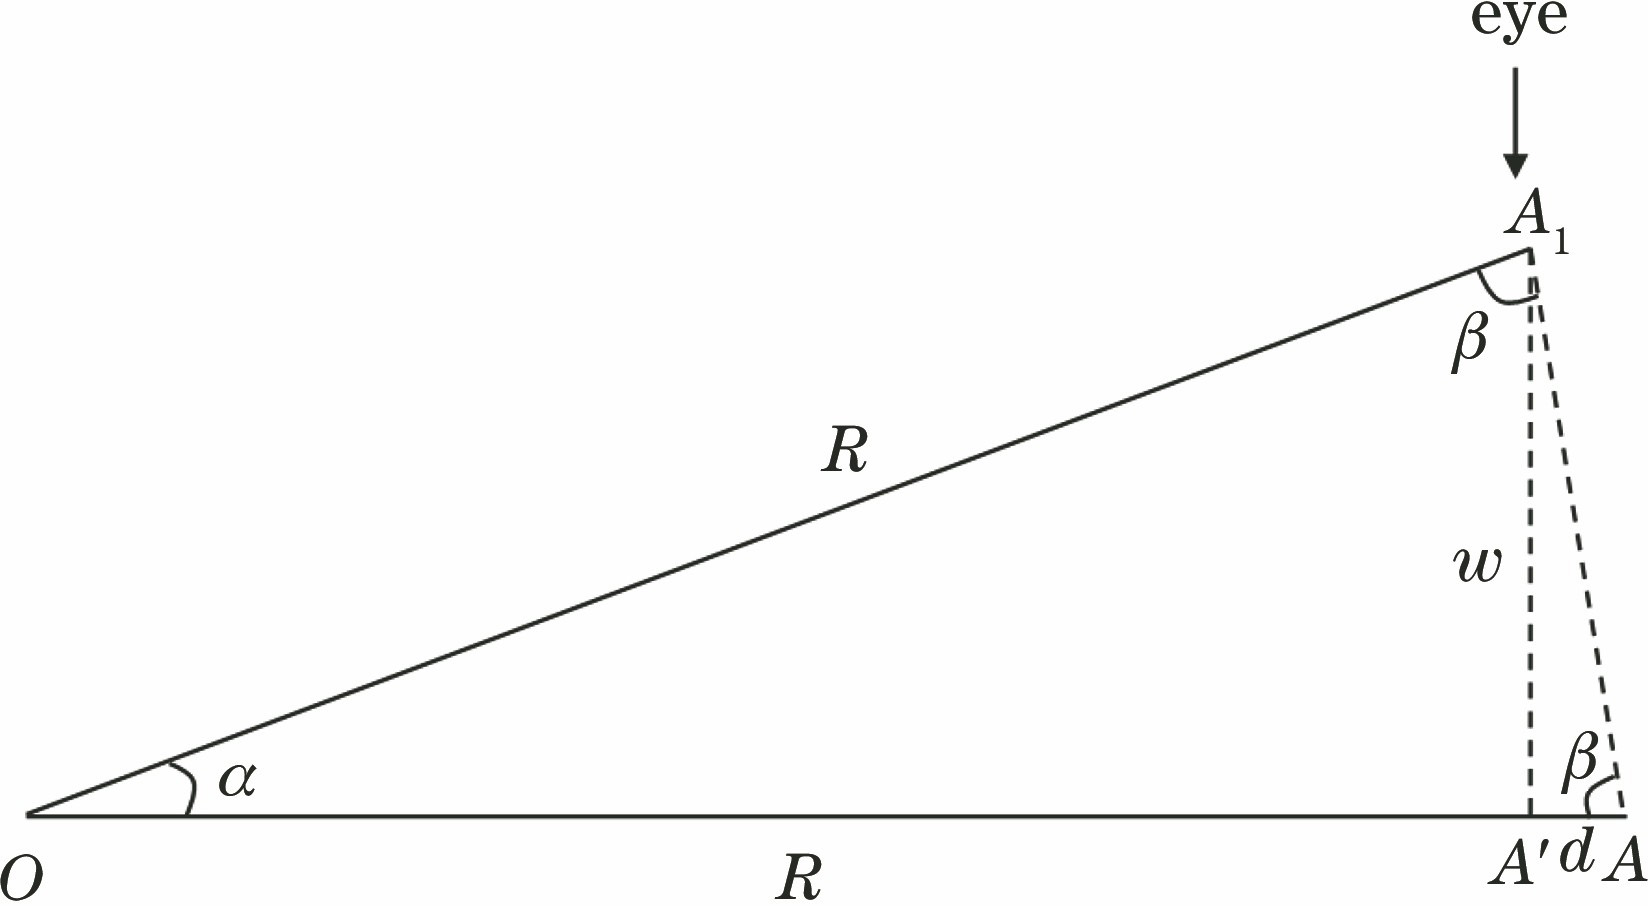
    Fig. 1. Wedged model
    Simulated optical fiber images under microscope. (a) Original image; (b) deformation image; (c) gray value distribution in y direction at x=200 before and after deformation
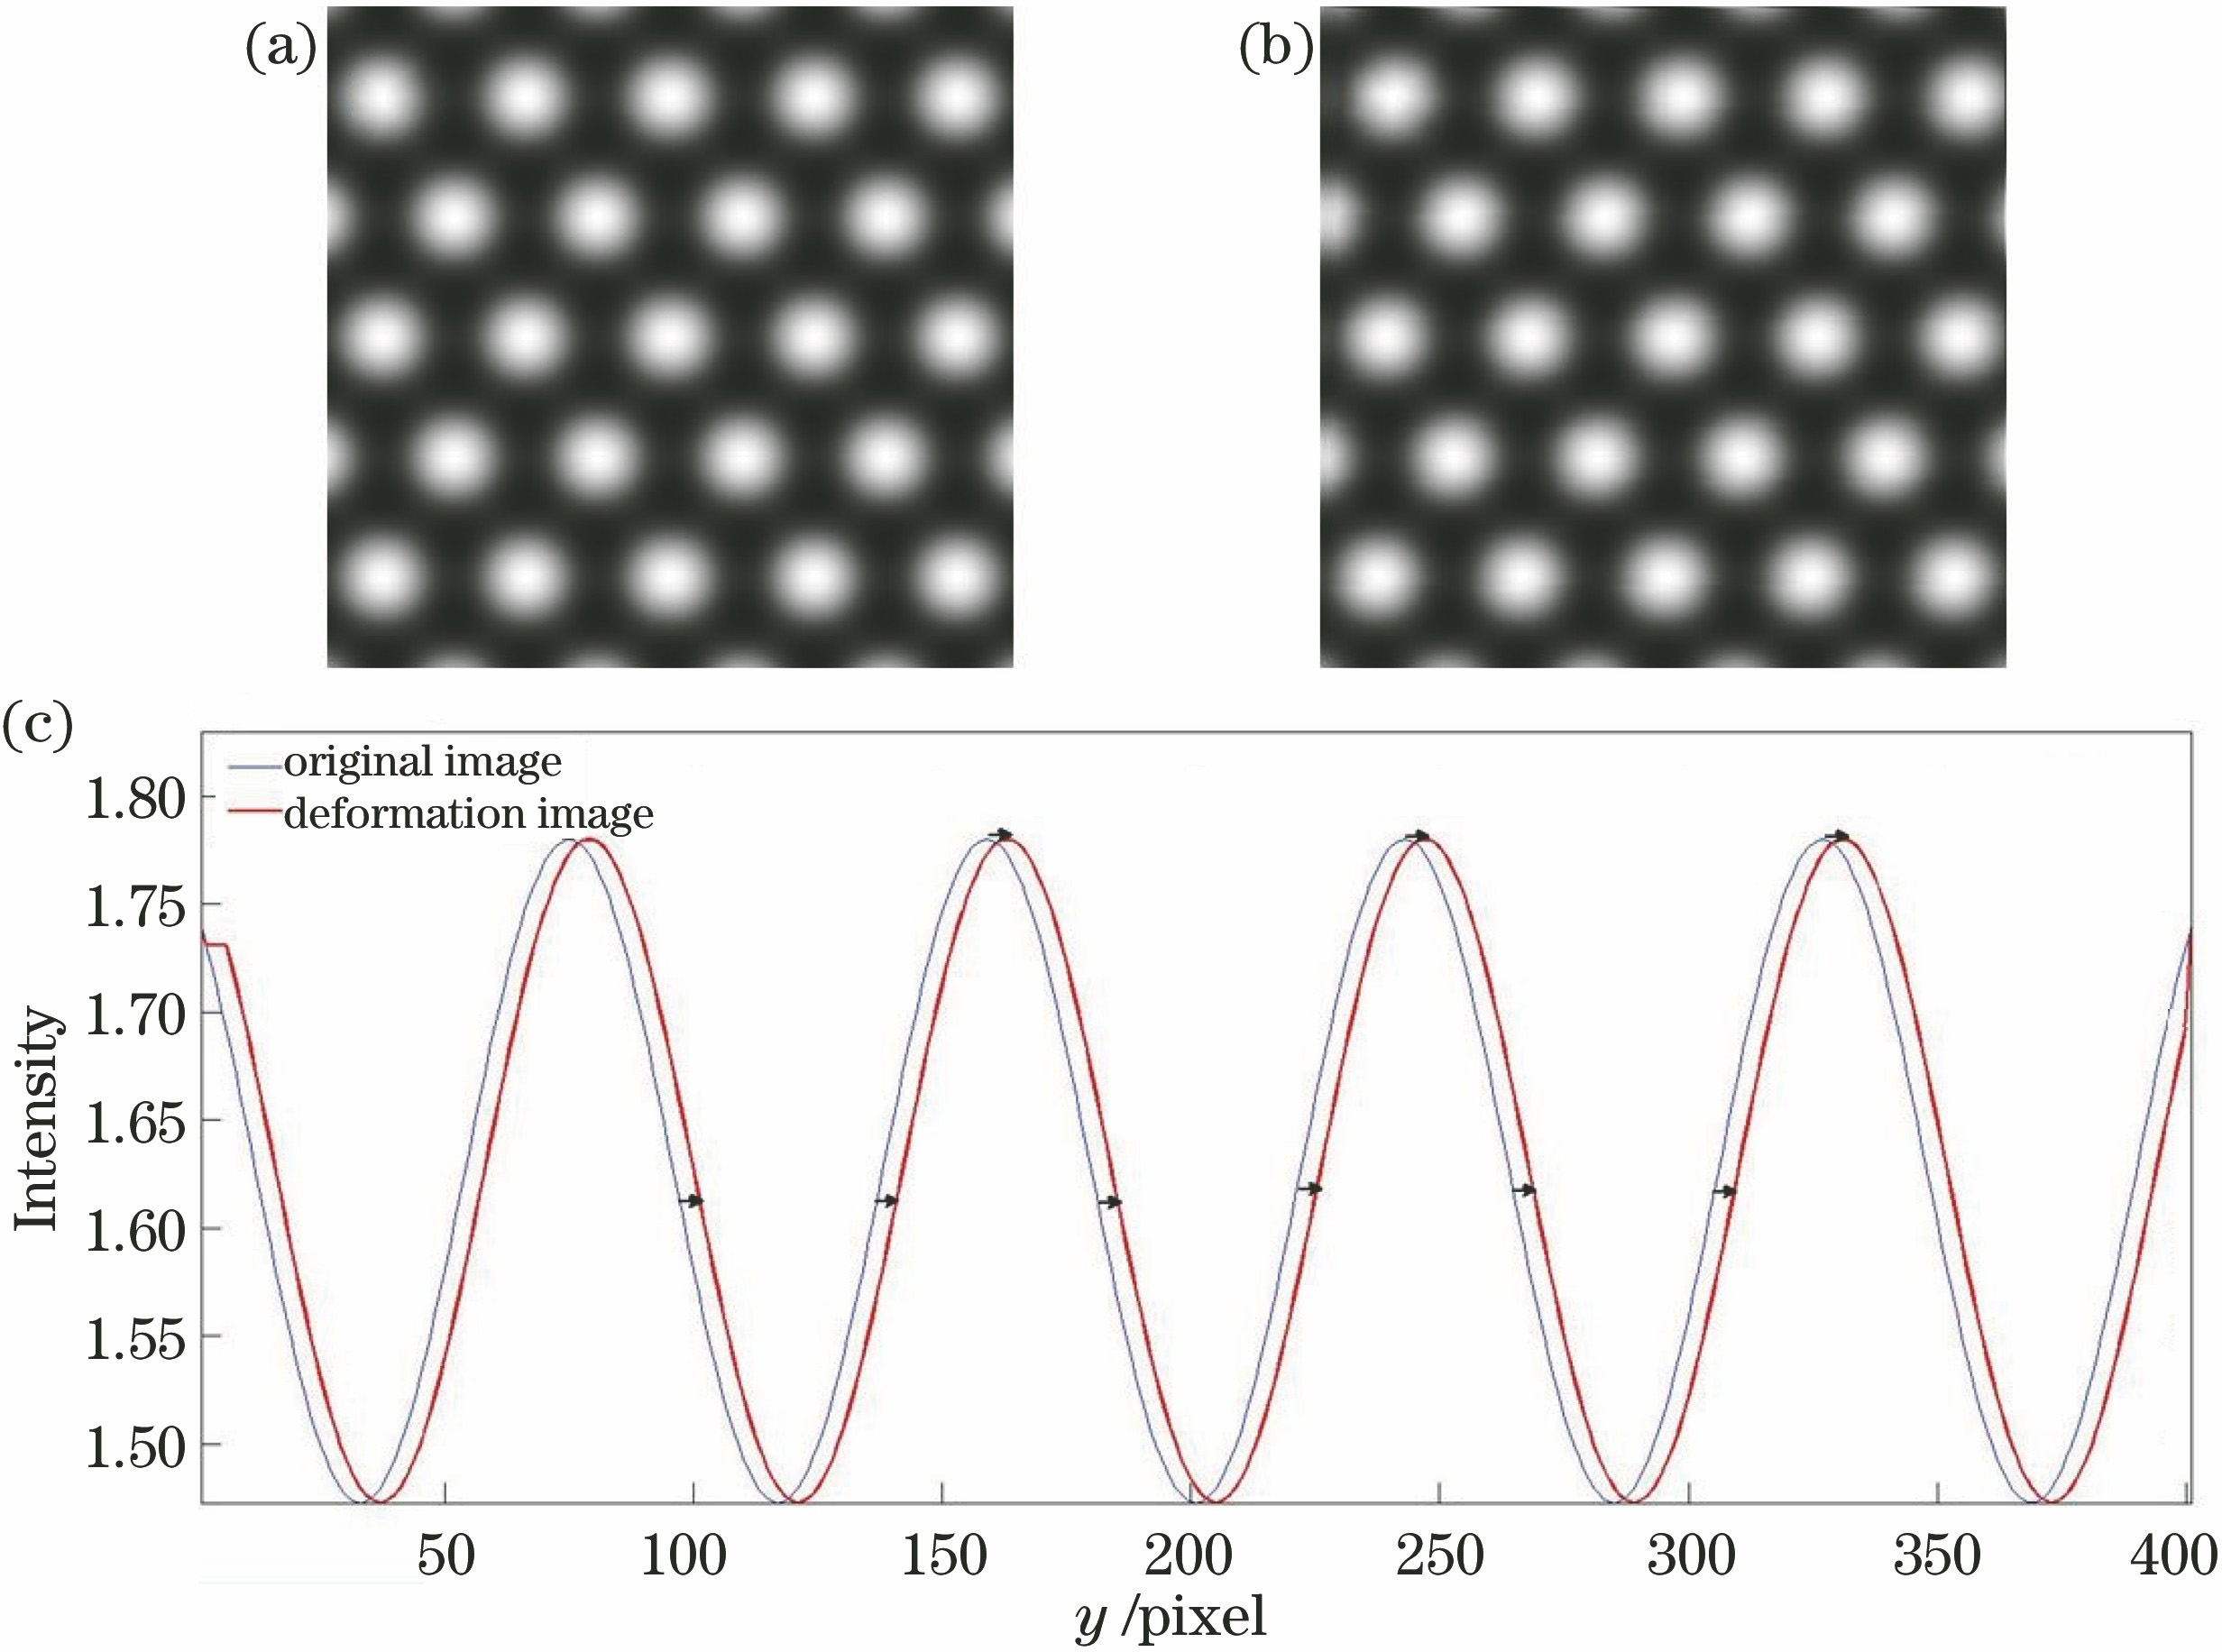
    Fig. 2. Simulated optical fiber images under microscope. (a) Original image; (b) deformation image; (c) gray value distribution in y direction at x=200 before and after deformation
    Experimental results. (a) Theoretical value of simulation experiment; (b) simulation experimental result; (c) comparison of experimental results at x=174
    Fig. 3. Experimental results. (a) Theoretical value of simulation experiment; (b) simulation experimental result; (c) comparison of experimental results at x=174
    Experimental setup. (a) Measurement schematic; (b) setup diagram; (c) holder and material
    Fig. 4. Experimental setup. (a) Measurement schematic; (b) setup diagram; (c) holder and material
    Experimental images. (a) Original image (α=0°); (b) α=6°; (c) α=8°; (d) α=9°; (e) α=10°; (f) gray value distribution in y direction at x=200
    Fig. 5. Experimental images. (a) Original image (α=0°); (b) α=6°; (c) α=8°; (d) α=9°; (e) α=10°; (f) gray value distribution in y direction at x=200
    Experimental results. (a) α=6°; (b) α=8°; (c) α=9°; (d) α=10°
    Fig. 6. Experimental results. (a) α=6°; (b) α=8°; (c) α=9°; (d) α=10°
    Comparison of experimental results and theoretical values at x=174
    Fig. 7. Comparison of experimental results and theoretical values at x=174
    Angle /(°)Theoreticalvalues /μmExperimentalvalues /μmRelativeerror /%Angle /(°)Theoreticalvalues /μmExperimentalvalues /μmRelativeerror /%
    6(y=172)1.4621.4461.096(y=173)1.4711.4412.08
    6(y=174)1.4791.4850.416(y=175)1.4881.4870.07
    8(y=172)1.9381.9480.518(y=173)1.9491.9620.66
    8(y=174)1.9611.9750.718(y=175)1.9721.9870.76
    9(y=172)2.1762.2111.619(y=173)2.1892.2241.60
    9(y=174)2.2012.2351.549(y=175)2.2142.2521.71
    10(y=172)2.4342.4400.2410(y=173)2.4482.4510.12
    10(y=174)2.4622.4560.2410(y=175)2.4762.4590.69
    Table 1. Experimental and theoretical values at y=172, 173, 174, 175 in Fig. 7
    Ran Zhao, Zhiwei Hong, Jing Lu, Yang Zhang, Yong Sun, Yonggang Huang, Jinsheng Jia. A New Method of Out-of-Plane Displacement Measurement for Optical Fiber Material Based on Digital Speckle Correlation Method[J]. Acta Optica Sinica, 2021, 41(17): 1712002
    Download Citation