
Philipp Graus, Thomas B. Möller, Paul Leiderer, Johannes Boneberg, Nikolay I. Polushkin. Direct laser interference patterning of nonvolatile magnetic nanostructures in Fe60Al40 alloy via disorder-induced ferromagnetism[J]. Opto-Electronic Advances, 2020, 3(1): 190027-1
- Opto-Electronic Advances
- Vol. 3, Issue 1, 190027-1 (2020)
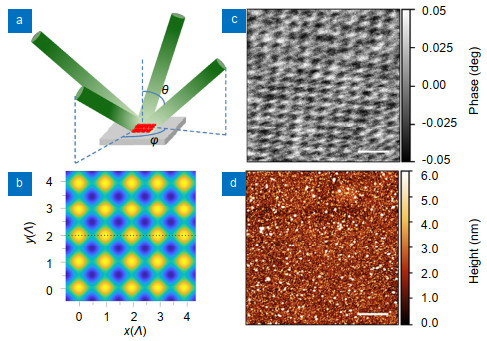
Fig. 1. (a ) Schematic of the DLIP geometry with four laser beams that impinge on the sample surface and their superposition provides the interference pattern. (b ) Laser intensity distribution simulated for all the beams of TE polarization and equal intensity, which incident at the same angle θ , while the azimuthal angles are φ i=π(i -1)/2, where i=1, 2, 3, 4. Under such parameters, the lattice periodicity is given by Λ =λ /(2sinθ )33. In our experiments, Λ was varied between 0.4 and 2.3 µm. (c ) MFM image of a Fe60Al40 35 nm thick sample treated by DLIP with Λ =0.4 μm and (d ) corresponding topography.
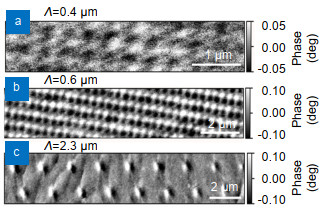
Fig. 2. MFM images of patterned structures that have different periodicities Λ of the interference pattern. (a ) 0.4 μm, (b ), 0.6 μm, and (c ) 2.3 μm.
Fig. 3. Correspondence between the laser-induced topographical relief (a) and MFM response (b). The bumps on the Fe60Al40 surface, occurring within maxima of light intensity (solid contours), are significantly smaller in their lateral dimensions than the regions in which the MFM response is nonzero. One of the patterned magnetic entities is indicated by dashed contour.
Fig. 4. (a ) Fe-based unit cells (top) and the (100) projections (bottom) of the atomic structure in the chemically ordered B2 and disordered A2 states of the Fex Al100-x (x ~50 at.%) alloy. The open boxes are vacancies in the lattice through which the atomic jumps occur for relaxation of the system to its thermodynamic equilibrium. In the A2 state there are magnetic percolation paths (dashed lines). (b ) Simulated change of magnetic moments in Fe under the transformation from the B2 to A2 state21.
Fig. 5. (a ) Absorbed fluence F abs as a function of coordinate along the dashed horizontal line in Fig. 1(b) with indications of different positions: 1. maxima of light intensity, where F abs=(1–R )F *>F m (F m is the absorbed fluence required for raising the temperature up to the melting point T m); 2. locations outside the melted zones, in which F c < F abs < F m (F c is the absorbed fluence required for raising the temperature up to T c); 3. local minima of light intensity. (b ) T (t ) dependencies calculated in positions 1, 2, and 3, where the absorbed fluence is respectively F abs=70 mJ/cm2, F abs=65 mJ/cm2, and F abs=35 mJ/cm2. As temperature elevation was calculated with no taking into account effects of melting and resolidification18, 20, the T (t ) dependence calculated at F abs>F m is shown by the dashed curve for t >t m, where t m is the moment of time at which the temperature rise reaches T m. (c ) Unit cell of the interference pattern with the marks for positions in which the T (t ) dependences plotted in (b) are simulated. (d ) Non-equilibrium vacancy concentration cv versus t in zone(s) 2 at T max=T m. The inset shows the asymptotic value cv(∞) at different temperature elevations T max-T c up to T max=T m. (e ) Concentration wave (superstructure) amplitude A (t )/A (0) as a function of time t in zone(s) 2 at different temperature elevations T max-T c up to T max=T m.
Fig. 6. MFM images of the patterned Fe60Al40 surface at the edge of the irradiated zone. The images were taken (a ) before and (b ) after thermal annealing in a furnace at T =770 K for one hour. (c ) Cross section of the MFM image before and after thermal annealing

Set citation alerts for the article
Please enter your email address
© Copyright 2018-2021 | Chinese Laser Press. All Rights Reserved 沪ICP备15018463号-20