
Jingcheng Wu, Lulu Shi, Yanan Du, Luhong Wen, Zhenzhi Shi. Fast Segmentation Method of Cell Image Based on Dual-Gaussian Filtering[J]. Laser & Optoelectronics Progress, 2022, 59(2): 0210002
- Laser & Optoelectronics Progress
- Vol. 59, Issue 2, 0210002 (2022)
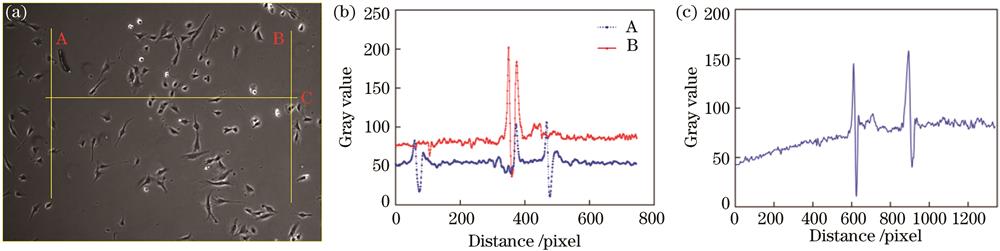
Fig. 1. Feature analysis of phase contrast microscopy image. (a) Cell image; (b) gray value distribution at longitudinal lines; (c) gray value distribution at transverse line
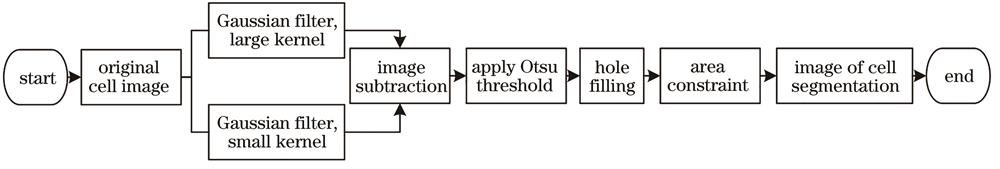
Fig. 2. Flow chart of the proposed method
Fig. 3. Dual-Gaussian filtering process. (a) Input image; (b) Gaussian filtering (large kernel); (c) Gaussian filtering (small kernel); (d) difference calculation
Fig. 4. Effect of different σ2 values on the segmentation results
Fig. 5. Relationship between σ2 value and standard deviation of fdg
Fig. 6. Comparison diagrams before and after dual-Gaussian filtering. (a) Before processing; (b) grayscale mapping before processing; (c) after processing; (d) grayscale mapping after processing
Fig. 7. Binary segmentation image. (a) Threshold segmentation; (b) hole filling; (c) area constraint
Fig. 8. Segmentation results of low-density cell images processed by different algorithms. (a) Cell image; (b) 2D-Otsu algorithm; (c) Jaccard algorithm; (d) Flight algorithm; (e) Vicar algorithm; (f) proposed algorithm
Fig. 9. Segmentation results of medium-density cell images processed by different algorithms. (a) Cell image; (b) 2D-Otsu algorithm; (c) Jaccard algorithm; (d) Flight algorithm; (e) Vicar algorithm; (f) proposed algorithm
Fig. 10. Segmentation results of high-density cell images processed by different algorithms. (a) Cell image; (b) 2D-Otsu algorithm; (c) Jaccard algorithm; (d) Flight algorithm; (e) Vicar algorithm; (f) proposed algorithm
Fig. 11. Comparison of segmentation results of different algorithms in complex situations
|
Table 1. Comparison of segmentation results using different algorithms
|
Table 2. Comparison of cell segmentation results of sample images

Set citation alerts for the article
Please enter your email address
© Copyright 2018-2021 | Chinese Laser Press. All Rights Reserved 沪ICP备15018463号-20