• Laser & Optoelectronics Progress
  • Vol. 55, Issue 6, 063003 (2018)
Tianyang Xu1、2、3、1; 2; 3; , Juan Yang1、1; , Xiaorong Sun4、5、4; 5; , Cuiling Liu4、5、4; 5; , Yi Li1、2、3、1; 2; 3; , Jinhui Zhou1、2、3、1; 2; 3; , and Lanzhen Chen1、2、1; 2; 3*;
Author Affiliations
  • 1 Institute of Apicultural Research, Chinese Academy of Agricultural Sciences, Beijing 100093, China
  • 2 Key Laboratory of Bee Products for Quality and Safety Control, Ministry of Agriculture, Beijing 100093, China
  • 3 Laboratory of Risk Assessment for Quality and Safety of Bee Products, Ministry of Agriculture, Beijing 100093, China
  • 4 School of Computer and Information Engineer, Beijing Technology and Business University, Beijing 100048, China
  • 5 Beijing Key Laboratory of Large Data Technology for Food Safety, Beijing 100048, China
  • show less
    DOI: 10.3788/LOP55.063003 Cite this Article Set citation alerts
    Tianyang Xu, Juan Yang, Xiaorong Sun, Cuiling Liu, Yi Li, Jinhui Zhou, Lanzhen Chen. Mid-Infrared Spectroscopy Analysis Combined with Support Vector Machine for Rapid Discrimination of Botanical Origin of Honey[J]. Laser & Optoelectronics Progress, 2018, 55(6): 063003 Copy Citation Text show less
    Mid-infrared spectra of different honey samples
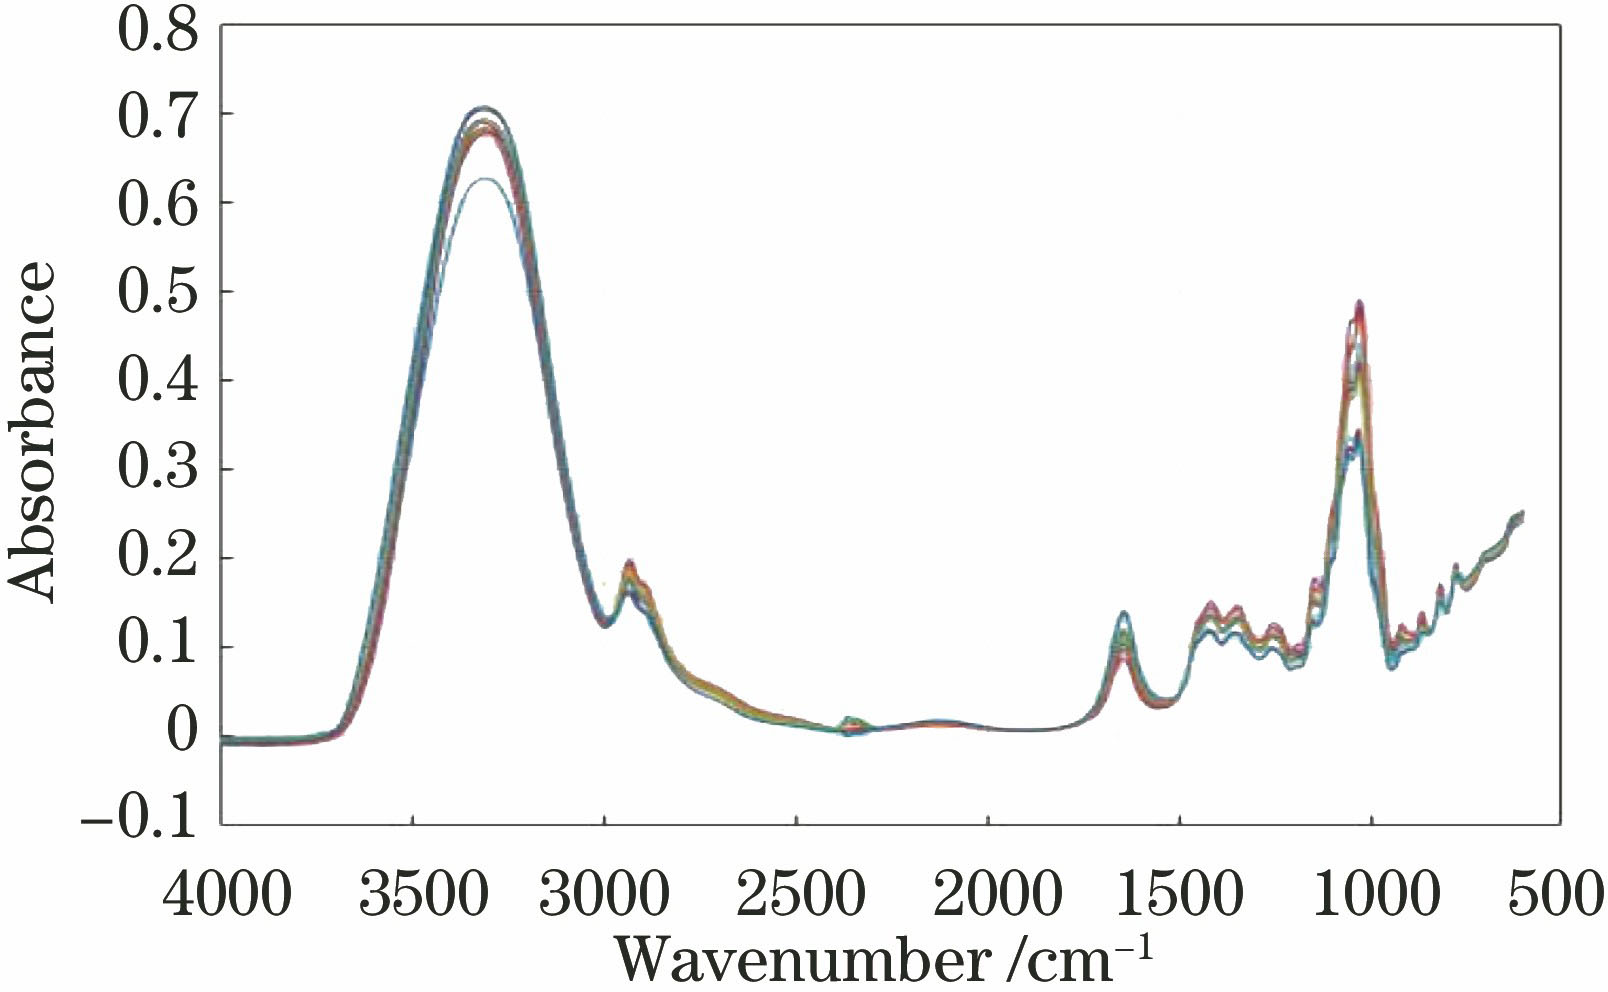
    Fig. 1. Mid-infrared spectra of different honey samples
    Actual and predicted classifications of test set using SVM algorithm when recognition rate is 100% and 20-dimensional feature data are input
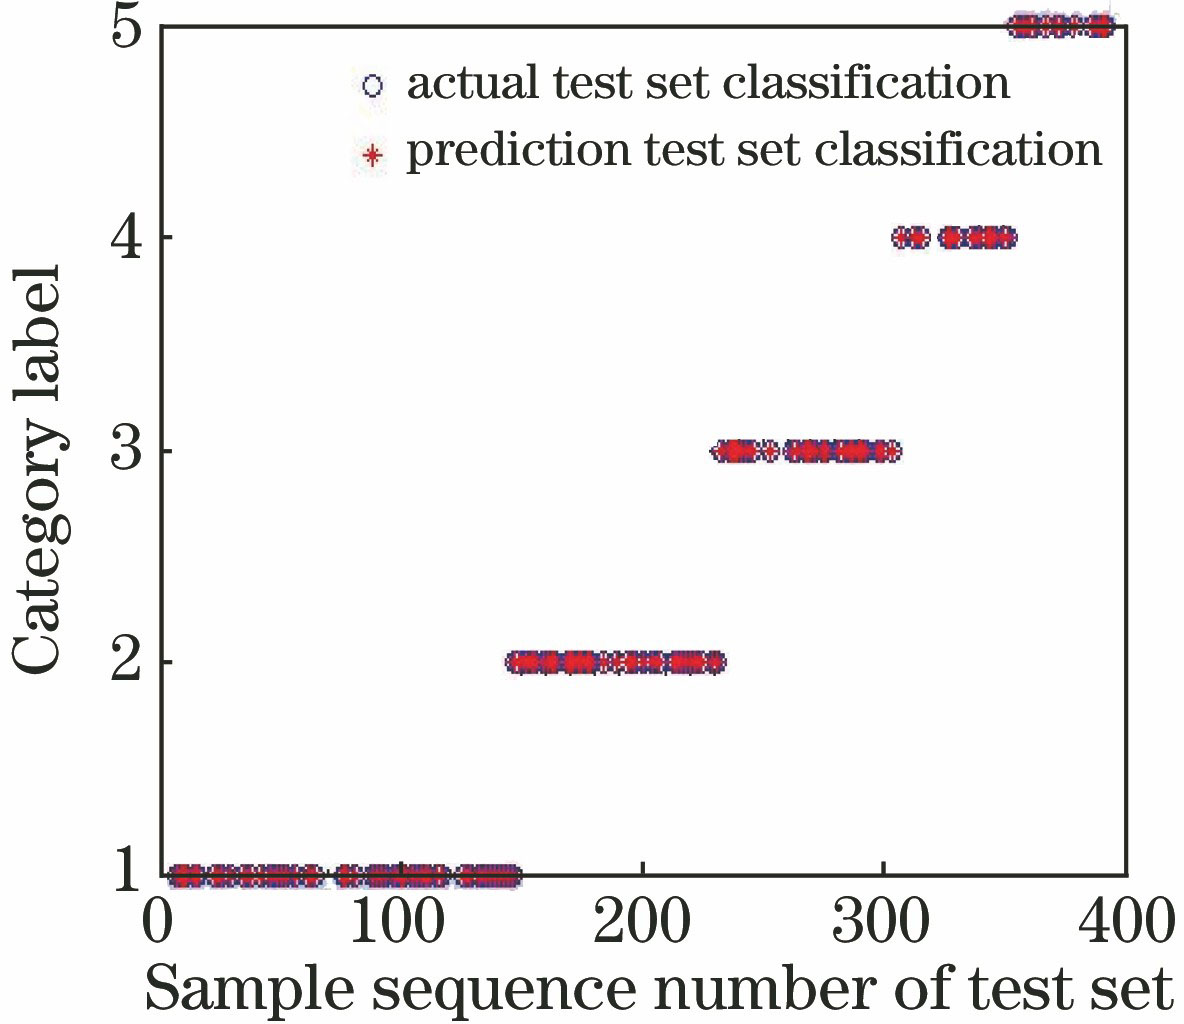
    Fig. 2. Actual and predicted classifications of test set using SVM algorithm when recognition rate is 100% and 20-dimensional feature data are input
    Actual and predicted classifications of test set using SVM algorithm when recognition rate is 99.23% and 20-dimensional feature data are input
    Fig. 3. Actual and predicted classifications of test set using SVM algorithm when recognition rate is 99.23% and 20-dimensional feature data are input
    Actual and predicted classifications of test set using LSSVM algorithm when recognition rate is 100% and 20-dimensional feature data are input
    Fig. 4. Actual and predicted classifications of test set using LSSVM algorithm when recognition rate is 100% and 20-dimensional feature data are input
    Actual and prediction classifications of test set using LSSVM algorithm when recognition rate is 97.69% and 20-dimensional feature data are input
    Fig. 5. Actual and prediction classifications of test set using LSSVM algorithm when recognition rate is 97.69% and 20-dimensional feature data are input
    Transformation graph of support vector from 1-dimensional space to 2-dimensional space
    Fig. 6. Transformation graph of support vector from 1-dimensional space to 2-dimensional space
    Dimension1235101520
    Contribution rate /%46.53982.27291.90896.05499.18899.12999.856
    Table 1. Cumulative variance contribution rate of different principal components
    Method5-dimension10-dimension15-dimension20-dimension
    PCA-SVM84.5487.3896.3897.77
    PCA-LSSVM87.3192.5496.1597.69
    Table 2. Average discrimination rate of different dimension feature data from linear SVM and LSSVM classifier models%
    Tianyang Xu, Juan Yang, Xiaorong Sun, Cuiling Liu, Yi Li, Jinhui Zhou, Lanzhen Chen. Mid-Infrared Spectroscopy Analysis Combined with Support Vector Machine for Rapid Discrimination of Botanical Origin of Honey[J]. Laser & Optoelectronics Progress, 2018, 55(6): 063003
    Download Citation