• Chinese Optics Letters
  • Vol. 21, Issue 5, 051102 (2023)
Yukun Wang1、2, Si Chen1, Kan Lin1, Xi Chen1, Zhengyang Xu1, Shiliang Lou3, Xin Ge4, Guangming Ni5, Xiaojun Yu6, Jianhua Mo7, Quanquan Mu2, and Linbo Liu1、*
Author Affiliations
  • 1School of Electrical and Electronic Engineering, Nanyang Technological University, Singapore 639798, Singapore
  • 2State Key Laboratory of Applied Optics, Changchun Institute of Optics, Fine Mechanics and Physics, Chinese Academy of Sciences, Changchun 130033, China
  • 3Key Laboratory of Opto-Electronics Information Technology of Ministry of Education, School of Precision Instruments and Opto-Electronic Engineering, Tianjin University, Tianjin 300072, China
  • 4School of Science, Shenzhen Campus of Sun Yat-sen University, Shenzhen 518107, China
  • 5School of Optoelectronic Science and Engineering, University of Electronic Science and Technology of China, Chengdu 610054, China
  • 6School of Automation, Northwestern Polytechnical University, Xi’an 710129, China
  • 7School of Electronics and Information Engineering, Soochow University, Suzhou 215006, China
  • show less
    DOI: 10.3788/COL202321.051102 Cite this Article Set citation alerts
    Yukun Wang, Si Chen, Kan Lin, Xi Chen, Zhengyang Xu, Shiliang Lou, Xin Ge, Guangming Ni, Xiaojun Yu, Jianhua Mo, Quanquan Mu, Linbo Liu. Multi-channel spectral-domain optical coherence tomography using single spectrometer[J]. Chinese Optics Letters, 2023, 21(5): 051102 Copy Citation Text show less
    Spectral distribution of the fiber array-based spectrometer.
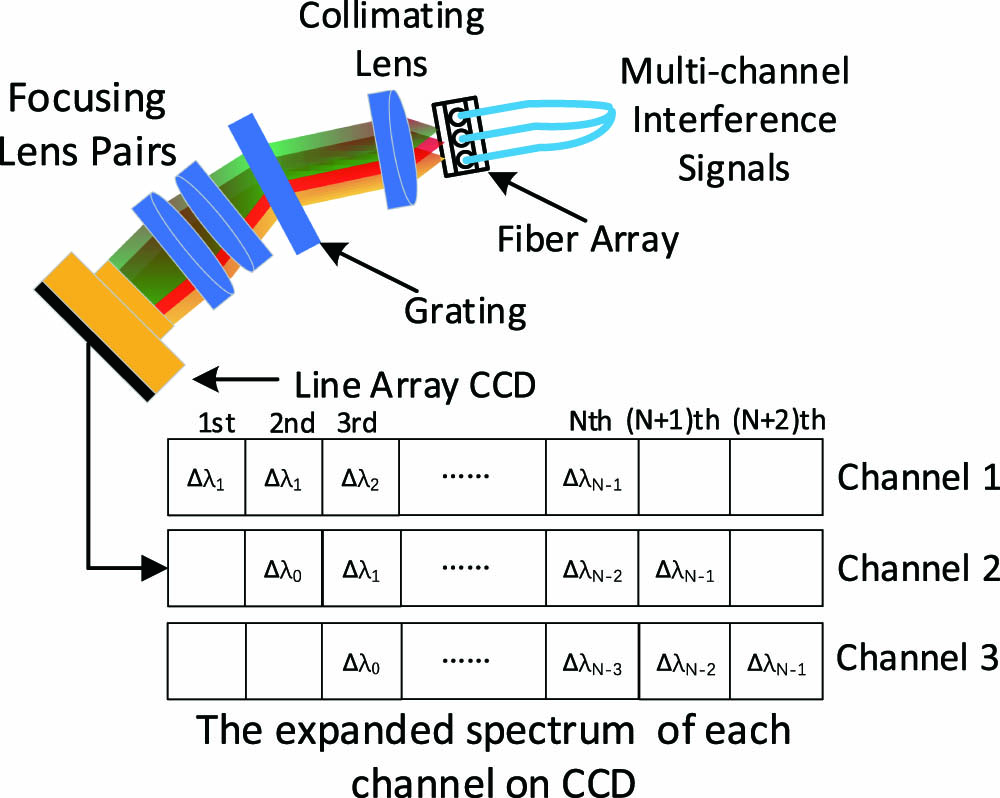
    Fig. 1. Spectral distribution of the fiber array-based spectrometer.
    Schematic of the experimental setup. A, B, C, H, and P are the fiber couplers. D, E, F, G, I, L, M, N, O, R, T, and U are achromatic doublet lenses. FS are the fused silica materials. X and Y are the mirrors. J is a mirror for collecting two-channel signals. S is the grating. V is the line-array camera. Q is the fiber array. K is a 2-dimensional galvanometer raster scanner.
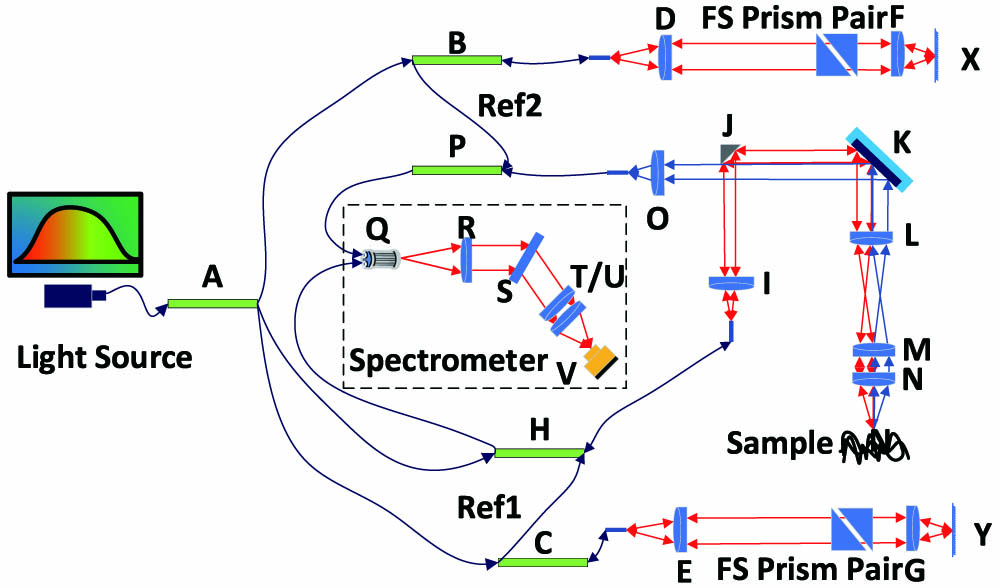
    Fig. 2. Schematic of the experimental setup. A, B, C, H, and P are the fiber couplers. D, E, F, G, I, L, M, N, O, R, T, and U are achromatic doublet lenses. FS are the fused silica materials. X and Y are the mirrors. J is a mirror for collecting two-channel signals. S is the grating. V is the line-array camera. Q is the fiber array. K is a 2-dimensional galvanometer raster scanner.
    Noise floor of the SD-OCT system. Curve A is the single channel, and Curve B is the two channels.
    Fig. 3. Noise floor of the SD-OCT system. Curve A is the single channel, and Curve B is the two channels.
    Noise floor of the SD-OCT system with the short-pulsed SC light source. Curve A is the single channel, and Curve B is the two channels.
    Fig. 4. Noise floor of the SD-OCT system with the short-pulsed SC light source. Curve A is the single channel, and Curve B is the two channels.
    Images of the Teflon material acquired with (a) the single channel and (b) the two channels. (c) The average depth intensity of all A-lines.
    Fig. 5. Images of the Teflon material acquired with (a) the single channel and (b) the two channels. (c) The average depth intensity of all A-lines.
    Yukun Wang, Si Chen, Kan Lin, Xi Chen, Zhengyang Xu, Shiliang Lou, Xin Ge, Guangming Ni, Xiaojun Yu, Jianhua Mo, Quanquan Mu, Linbo Liu. Multi-channel spectral-domain optical coherence tomography using single spectrometer[J]. Chinese Optics Letters, 2023, 21(5): 051102
    Download Citation