
Yukun Wang, Si Chen, Kan Lin, Xi Chen, Zhengyang Xu, Shiliang Lou, Xin Ge, Guangming Ni, Xiaojun Yu, Jianhua Mo, Quanquan Mu, Linbo Liu. Multi-channel spectral-domain optical coherence tomography using single spectrometer[J]. Chinese Optics Letters, 2023, 21(5): 051102
- Chinese Optics Letters
- Vol. 21, Issue 5, 051102 (2023)
Abstract
1. Introduction
Optical coherence tomography (OCT) is a low coherence interferometric imaging technique[1] that provides depth-resolved, cross-sectional images with micrometer-scale resolution. After three decades of development, OCT has been widely used in the field of ophthalmology[2,3]. Following the introduction of time-domain OCT in 1991, Fourier-domain OCT (FD-OCT) has been developed, which has improved sensitivity and imaging speeds by 2–3 magnitudes[4,5]. However, there is an inherent trade-off between the two metrics. Increasing speed means that the exposure time is shortened, and the signal strength will be reduced. At the same time, excess noise may rise as exposure time decreases[5–7], further deteriorating sensitivity, particularly in electrical noise-limited systems[6].
The straightforward way to improve imaging speeds without compromising sensitivity is to parallelize illumination and detection[8–11]. Line-field OCT has been reported to achieve MHz A-scan rates, which is at least 1 order of magnitude higher than the standard point scanning devices[12,13]. More importantly, a line focus allows for higher total permissible exposure, which enables higher signal strength[13,14]. Line-field OCT is implemented with free-space optics and is not compatible with a fiber interferometer. Multi-channel OCT is another way of parallelization, which is compatible with fiber-based systems[15–18]. Multi-channel OCT has many advantages, such as improving imaging depth, imaging speed, and the field of view by multiple focuses. However, many of the previously reported multi-channel OCT designs require multiple detectors[16], which complicates system construction and increases cost. Those employing single detectors have to either compromise the back-coupling efficiency of the signal in order to combine multiple signals into a single mode channel[17] or compromise the total ranging depth due to reduced spectral resolution[18].
Another way to improve sensitivity, rather than parallelizing illumination and detection, is to reduce noise. The noise sources in FD-OCT include the electrical noise of the detector, shot noise, and relative intensity noise (RIN) from the reference arm light[6,7]. The signal-to-noise ratio (SNR) reaches its maximum value when the electrical noise and RIN are equal[6]. Shot noise is quantum-limited intensity noise and cannot be changed. RIN is determined by a detection spectral bandwidth, so theoretically it is possible to reduce excess noise. However, there is no study reported toward this end.
Sign up for Chinese Optics Letters TOC. Get the latest issue of Chinese Optics Letters delivered right to you!Sign up now
In this Letter, we show that the use of multi-channel spectral-domain OCT (SD-OCT), which combines signals of more than one channel into a single spectrometer with a fiber array and equivalently increases the light bandwidth in a single pixel, can achieve RIN suppression. Compared with the traditional multi-channel SD-OCT, the scheme proposed in this Letter has only one spectrometer, reducing the costs and the RIN. We demonstrate the utility of this method by deducing the formulas of the noise source and the SNR and by building an experimental system to verify the effectiveness of the method with both shot-noise and RIN-dominated broadband sources.
2. Principle and Experimental Setup
2.1. Principle of multi-channel SD-OCT
The system is a Michelson interferometer structure. The differences in the traditional Michelson interference instrument are that the reference light needs to have multiple separate arms for the multi-channel interference signals, and the sample arm needs to separate and collect multiple signals simultaneously. The characteristic of our multi-channel SD-OCT is the simultaneous detection of multi-channel signals with only one spectrometer. The multi-channel signals can be collected by adding a mirror or beam splitter, and then by entering the spectrometer through a fiber array. In this configuration, the multi-channel signals will enter the spectrometer in parallel, as is shown in Fig. 1. This configuration has the advantages of low cost, high utilization of light energy, and low noise. It only needs to add a mirror to separate the multi-channel light. Hence, it can be used to retrofit the existing OCT system at a lower cost. The photons from the sample are scattered. Through the multiple channels, more scattered photons can be collected, thereby increasing the utilization of the light energy. The noise characteristic will be discussed in the next section.
![]()
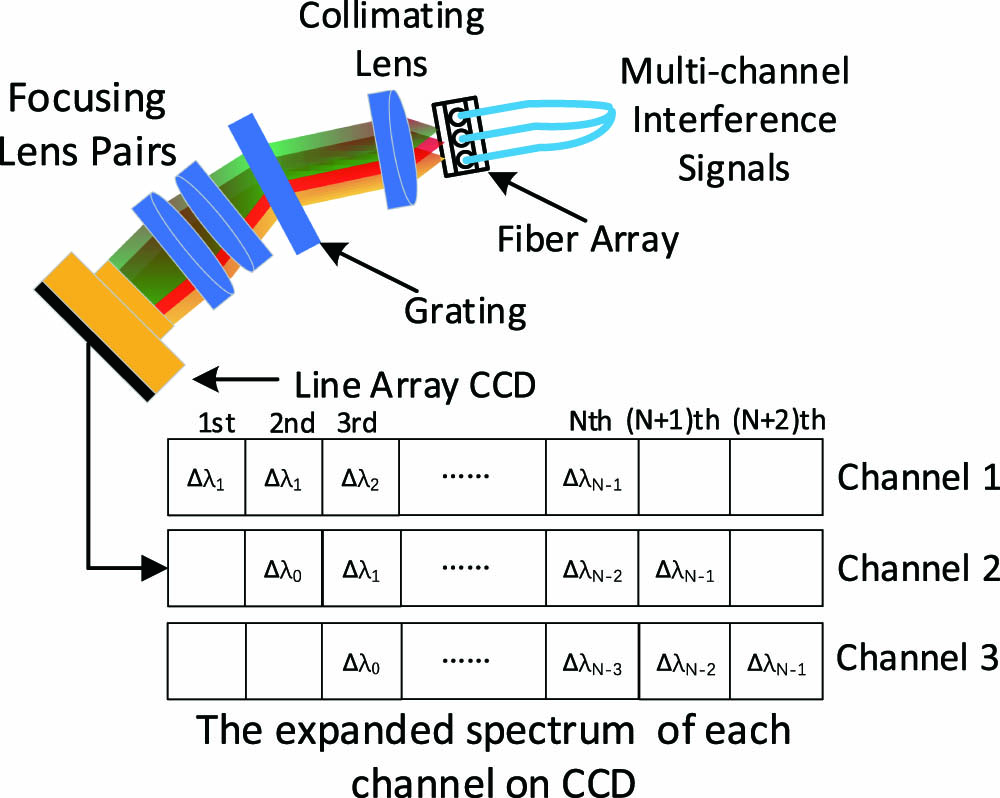
Figure 1.Spectral distribution of the fiber array-based spectrometer.
2.2. Noise analysis
The signal and noise theories of FD-OCT have been clearly described in previous reports[5,6]. In brief, the number of photoelectrons, , collected by the detector is related to the optical power as
Figure 1 is an example of the setup of the three channels that describes our concept. The multiple signals will enter the spectrometer through the fiber array, and the fiber array is arranged in parallel with equal space displacement. The fiber array is used to mount multiple input fibers at the focal plane of the collimation lens of the spectrometer, and the same spectrum segment of each channel is distributed in different pixels of the line array CCD by precise optical design. As is shown in Fig. 1, there are three lines, each corresponding to the spectral distribution of each channel. Since the three-channel signal enters the spectrometer at the same time, the spectral width on each pixel is widened by three times. For example, the spectral width on the 3rd pixel is , which is three times wider than that of one channel. For the channels, the spectral bandwidth on each pixel will be widened by times.
With the spectral bandwidth increased by times, the power of the reference arm should be increased by times to satisfy the maximum SNR condition. Rewriting Eq. (6) as the following:
From Eq. (8), the addition of in the denominator makes the denominator smaller, thereby improving the SNR when compared with Eq. (6). The effect of the SNR improvement needs to be discussed in three conditions. First, when the system is shot-noise limited, by increasing the number of channels, the improvement of the SNR is not significant. The second condition is that when the electrical noise dominates the system noise, such as in a high-speed system or those using InGaAs-based cameras[6,19], increasing the number of channels will significantly improve the SNR. The third condition is that when the RIN is dominating, such as those powered by a supercontinuum (SC) light source[20,21], the SNR will also be significantly improved. Although most of the commercial-grade and research-grade OCT systems are shot-noise limited, an important development direction of OCT is a high-speed system, which has been raised to MHz. For skin and deep ophthalmology imaging, the waveband needs to be expanded to near infrared 1060 nm or 1300 nm, where the InGaAs camera is needed. For blood oxygen saturation measurement, the waveband is 570–600 nm, where the SC light sources are required. Hence, there are still many applications that are not short-noise limited. The proposed method in this Letter will be very useful for high-speed systems, systems using InGaAs-based cameras, and SC light sources.
2.3. Experimental setup
To experimentally verify the above-mentioned noise repression, we designed and developed a dual-channel fiber-based SD-OCT system (Fig. 2). As is shown in Fig. 2, the OCT system utilized a super luminescent diode (M-T-850-HP, Superlum Diodes Ltd., Ireland) with a central wavelength of approximately 850 nm and a spectral bandwidth of 50 nm at half-maximum, which yielded an axial resolution of 6.37 µm in air. After being split by the coupler A, one path enters the two reference arms through couplers B and C. The other path enters the sample arm through coupler H. The two reference arms are used to provide reference light for the two channels respectively. The splitting ratios of the fiber couplers are selected to ensure that the power entering the reference arms meets the best SNR condition (the electrical noise equal to the RIN). The light in the reference arms is collimated by lenses D, E (AC050-010-B-ML, Thorlabs, USA) and focused by lenses F, G (AC254-030-B-ML, Thorlabs, USA) onto the reference mirrors X and Y (BB111-E03, Thorlabs, USA). The sample arm is optimized using OpticStudio (Zemax, LLC, USA). The illumination light on the sample arm is collimated by lens I (AC050-008-B-ML, Thorlabs, USA) with a diameter of 2 mm, and the light enters the paired galvanometer scanning mirror K (GVS002, Thorlabs, Newton, NJ, USA) through a knife-edge pick-off mirror J (#36-137, Edmund Optics Inc., USA). The scanner mirror K is conjugated and scaled to the focusing lens N (AC254-016-B-ML, Thorlabs, USA) with telescope relay lenses pair L (AC508-150-B-ML, Thorlabs, USA) and M (AC508-075-B-ML, Thorlabs, USA). The beam, after focusing lens N, is focused onto the sample with a beam diameter of 1 mm and a spot size of 16.6 µm. The backscattered light from the sample is divided into direct scattered light and small-angle scattered light. The direct scattered light is shown in red line, which is consistent with the illumination light path and collected by lens I. The small-angle scattered light is shown with a blue line, the diameter is 2 mm, and the blue and red lines are parallel distributed on both sides of the light path center. The blue light beam will pass through the edge of mirror J and be collected by lens O (AC080-016-B-ML, Thorlabs, USA). The blue and red lights enter the couplers P and H, respectively, and interfere with the matched reference light. Finally, the interfering signals enter the spectrometer through the fiber array Q.
![]()
Figure 2.Schematic of the experimental setup. A, B, C, H, and P are the fiber couplers. D, E, F, G, I, L, M, N, O, R, T, and U are achromatic doublet lenses. FS are the fused silica materials. X and Y are the mirrors. J is a mirror for collecting two-channel signals. S is the grating. V is the line-array camera. Q is the fiber array. K is a 2-dimensional galvanometer raster scanner.
In the spectrometer, two input fibers are mounted with a V-groove with a spacing of 127 µm. The collimated beams are dispersed by an 1800 lines/mm diffraction grating (WP-HD1800/840, Wasatch Photonics, USA) and imaged by a multi-lens combination (the effective focal length is 194 mm) onto a 12-bit line camera (EV71YEM4CL2014-BA9, e2V, UK). The camera has a sensor of 2048 pixels with a pixel size of . The total photon-to-electron conversion efficiency of the spectrometer was measured to be 0.32, which includes the diffraction efficiency of the grating and quantum efficiency () of the CCD. After optimization, the pixel-limited spectral resolution of the spectrometer is 26.1 pm, so the measurable bandwidth of the spectrometer is 53.45 nm. The 3 dB roll off of our costumed spectrometer is measured by translating a mirror reflector along the axial direction on the reference arm. The sensitivity at the maximum line rate 70 kHz of 3-dB roll off is 48% of the full depth, which is acceptable for use of the full depth range.
3. Results and Discussion
To demonstrate the noise repression by multiple reference arms, we calculate the theoretical sensitivity of the single and the two reference arms. From the manual of the line camera, the electrical noise is 137 electrons for a single pixel. When the image speed is set to 70 kHz, the reference power for the single arm should be set to 7.74 µW (1003 CCD counts) with Eq. (5) and the total reference power for the two arms should be set to 10.96 µW (1414 CCD counts) with Eq. (7), which is 5.48 µW (710 CCD counts) for each arm. At this time, the electrical noise and the RIN are equal. According to Eq. (4), the shot noises for the single and the two arms are 277 electrons and 329 electrons, respectively. Then, we measured the max sample arm power of 113.4 µW returning from a 100% reflective silver mirror to the spectrometer. This optical power at a single pixel corresponded to Ns = 1.1208 × 10⁶. Therefore, for the noise electrons described earlier, Eq. (8) predicted a theoretical sensitivity of 91.8 dB and 92.3 dB for the single and two arms, respectively. The sensitivity can be improved by about 10%.
Figure 3 shows the measured noise data. Curve A (blue line) represents the noise floor of the single reference arm averaged at 500 A-lines and obtained with the sample arm blocked. Curve B represents the noise floor of two channels, and the power of each reference arm is half the power of the single arm. As the depth increases, the deviation becomes smaller due to the influence of the roll off, and the closer to the zero point, the more accurate the result. At the position of depth 40 the noise is reduced from 214 counts to 188 counts, a reduction of about 10%, which is consistent with the previous analysis.
![]()
Figure 3.Noise floor of the SD-OCT system. Curve A is the single channel, and Curve B is the two channels.
Since the electrical noise is only 55 counts, accounting for 25% of the total noise, the system is not dominated by electrical noise, so the improvement of the method in this paper is limited. For a more dramatic improvement, the electrical noise should dominate the total noise. We can increase the imaging speed, and the sensitivity will be further improved, e.g., 20% improvement for a 250 kHz camera (OCTOPLUS, e2V, UK). Or with a short-pulsed SC light source, the total noise is dominated by the electrical noise. Then, we changed the light source to an SC source (SuperK extreme OCT, NKT Photonics, Denmark), which is employed to repeat the above experiments. The reference arm power was set to , which is the same as the theoretical analysis.
Figure 4 shows the experimental results of the SC source. Curve A is the noise floor of the single channel averaged at 500 A-lines and obtained with the sample arm blocked, while curve B is that of two channels, and the power of each reference arm is half the power of the single arm. At the depth of 61, the noise floor is reduced from 864 counts to 583 counts, and the improvement is about 32%. In this case, our method can significantly improve the sensitivity with the short-pulsed SC light source.
![]()
Figure 4.Noise floor of the SD-OCT system with the short-pulsed SC light source. Curve A is the single channel, and Curve B is the two channels.
Using the same light source, we imaged a Teflon sample. When we collect the single channel image, the power from Ref 1 meets the condition of the best SNR (the electrical noise equal to the RIN). Then, we blocked Ref 2 and the blue line in Fig. 2. Figure 5(a) is the image acquired by the single channel. When we collect the two channels’ image, the power from Ref 1 and Ref 2 is half of the power in the single-channel reference arm, and all the channels are unblocked. Two channels can actually get two images. By adjusting the optical path difference (OPD), the two images can be overlapped. The image in Fig. 5(b) is the overlapped result and shows that the speckle is reduced by a factor of for two channels, when compared to the single channel, due to the effect of averaging the images of the two channels at the same depth. There is still residual dispersion found in Fig. 5(b), which is due to the inconsistent dispersion in the two channels. We can only correct one channel’s dispersion with one spectrum. But this residual dispersion will not affect the evaluation of the SNR improvement in this Letter. Figure 5(c) is the curve of all the A-lines after averaging, reflecting each signal’s intensity of different depths. It is obvious that the image intensity of the two channels is better than the image intensity of the single channel.
![]()
Figure 5.Images of the Teflon material acquired with (a) the single channel and (b) the two channels. (c) The average depth intensity of all A-lines.
4. Conclusion
In summary, we propose a method to implement multi-channel SD-OCT with a single spectrometer. We theoretically analyze the mechanism of noise suppression when there are multiple reference arms based on the noise classification and the expression of the noise. From the theoretical sensitivity equations, it can be seen that the more reference arms, the greater the improvement, but the reference arms cannot be increased indefinitely, which will increase the complexity of the system; usually two or three are sufficient. We discussed the significance of this novel technique in two cases, shot noise-dominated and electrical noise or RIN-dominated, and experimentally verified the two cases. The theoretical calculations show that the method proposed in this paper has obvious effects on the electrical- and RIN-dominated systems, and the sensitivity improvement of the two cases is measured by experiments, which proves the conclusion that the proposed technique can significantly improve the SNR of multi-channel SD-OCT when the system is either RIN or electrical-noise limited. The improvement is marginal when it is shot-noise limited. Therefore, for the SD-OCT system of high-speed, short-pulsed SC light sources or InGaAs-based cameras or other systems dominated by electrical noise or RIN, the method in this paper can be used to improve the system sensitivity.
References

Set citation alerts for the article
Please enter your email address
© Copyright 2018-2021 | Chinese Laser Press. All Rights Reserved 沪ICP备15018463号-20