
Li Yuan, Jishou Yuan, Dezheng Zhang. Remote Sensing Image Classification Based on DeepLab-v3+[J]. Laser & Optoelectronics Progress, 2019, 56(15): 152801
- Laser & Optoelectronics Progress
- Vol. 56, Issue 15, 152801 (2019)
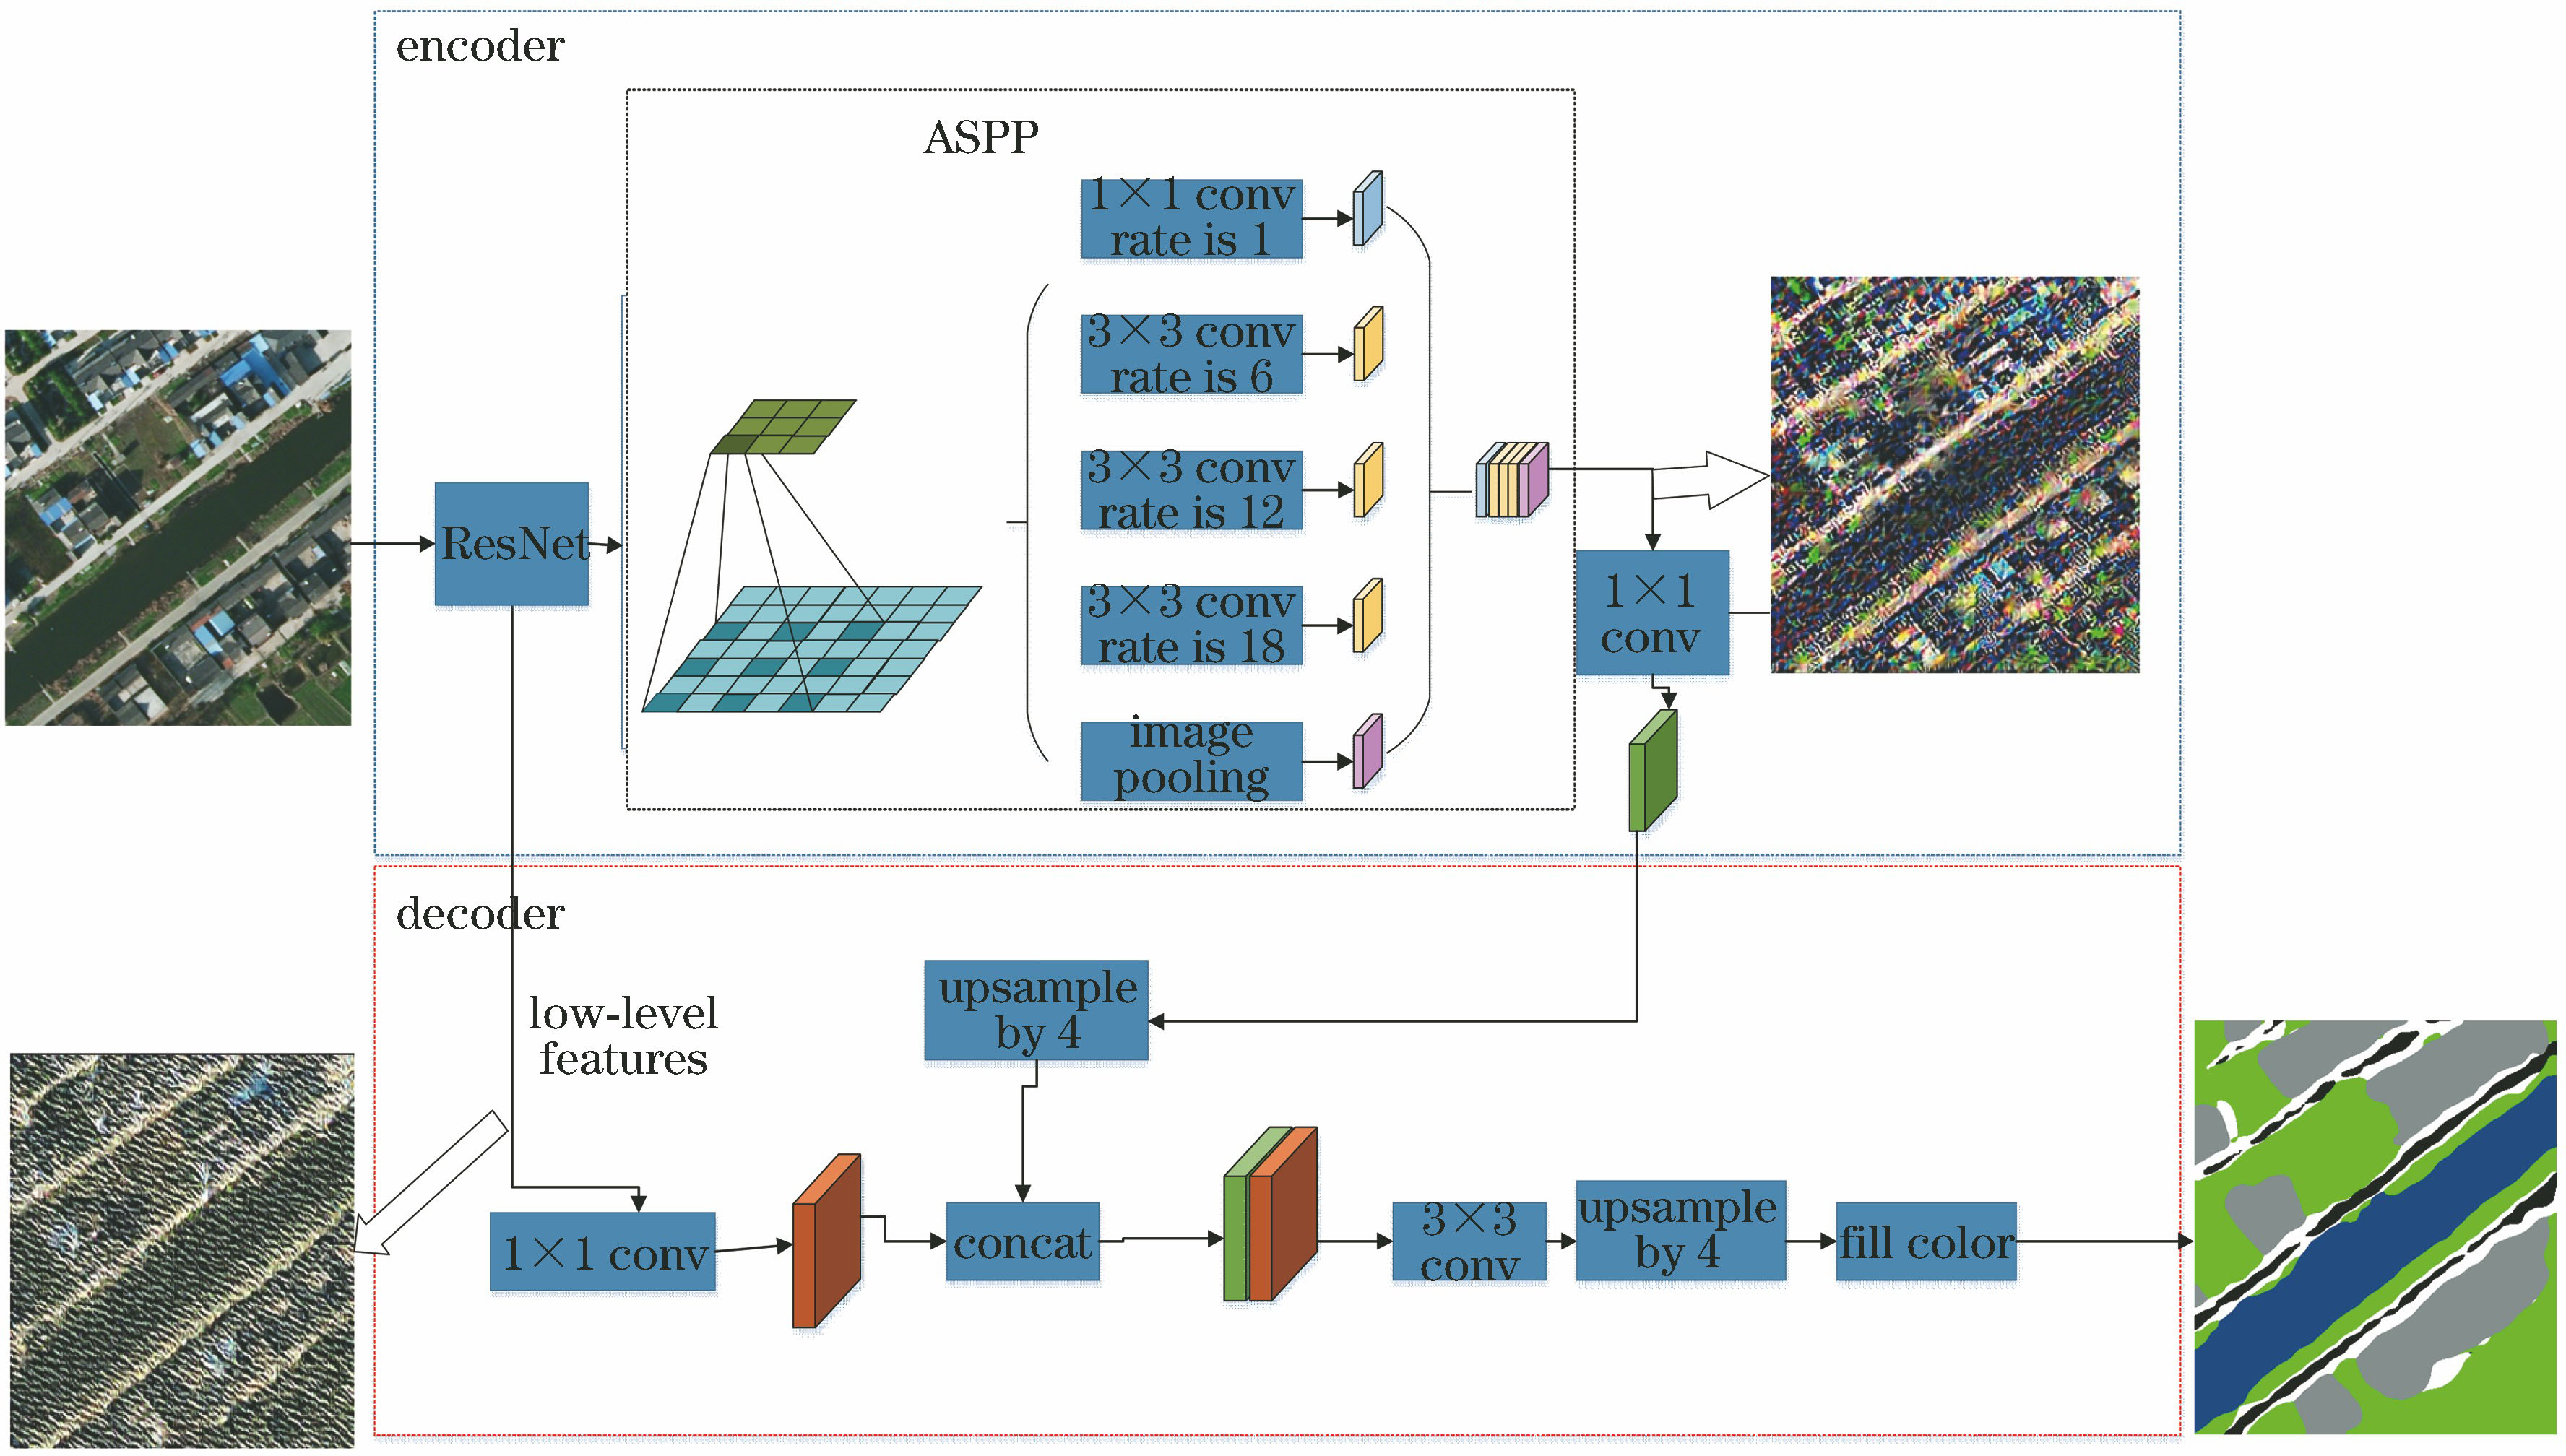
Fig. 1. System diagram of remote sensing image classification based on DeepLab-v3+
![Diagrams of abtrous convolution[11]. (a) Sparse feature extraction; (b) dense feature extraction](/richHtml/lop/2019/56/15/152801/img_2.jpg)
Fig. 2. Diagrams of abtrous convolution[11]. (a) Sparse feature extraction; (b) dense feature extraction
Fig. 3. Structure of atrous spatial pyramid pooling
Fig. 4. Structure of encoder-decoder module
Fig. 5. Example of dataset. (a) Original images; (b) labels
Fig. 6. Loss curve
Fig. 7. 64 feature maps obtained from the first convolution layer
Fig. 8. Segmentation effect by DeepLab-v3+; (a) Original image; (b) segmentation result by DeepLab-v3+
Fig. 9. Comparison of loss of different models
Fig. 10. Comparison of segmentation results of DeepLab-v3+ and other models. (a) Original images; (b) segmentation results of FCN; (c) segmentation results of U-Net; (d) segmentation results of DeepLab-v3+
Fig. 11. Segmentation results of DeepLab-v3+ and other models on GID dataset. (a) Original image; (b) segmentation result of FCN; (c) segmentation result of U-Net; (d) segmentation result of DeepLab-v3+
|
Table 1. Training parameters
|
Table 2. Precision and running time of DeepLab-v3+ and other models
|
Table 3. Precision of DeepLab-v3+ and other models on GID dataset

Set citation alerts for the article
Please enter your email address
© Copyright 2018-2021 | Chinese Laser Press. All Rights Reserved 沪ICP备15018463号-20