
Fumika Isono, Jeroen van Tilborg, Samuel K. Barber, Joseph Natal, Curtis Berger, Hai-En Tsai, Tobias Ostermayr, Anthony Gonsalves, Cameron Geddes, Eric Esarey. High-power non-perturbative laser delivery diagnostics at the final focus of 100-TW-class laser pulses[J]. High Power Laser Science and Engineering, 2021, 9(2): 02000e25
- High Power Laser Science and Engineering
- Vol. 9, Issue 2, 02000e25 (2021)
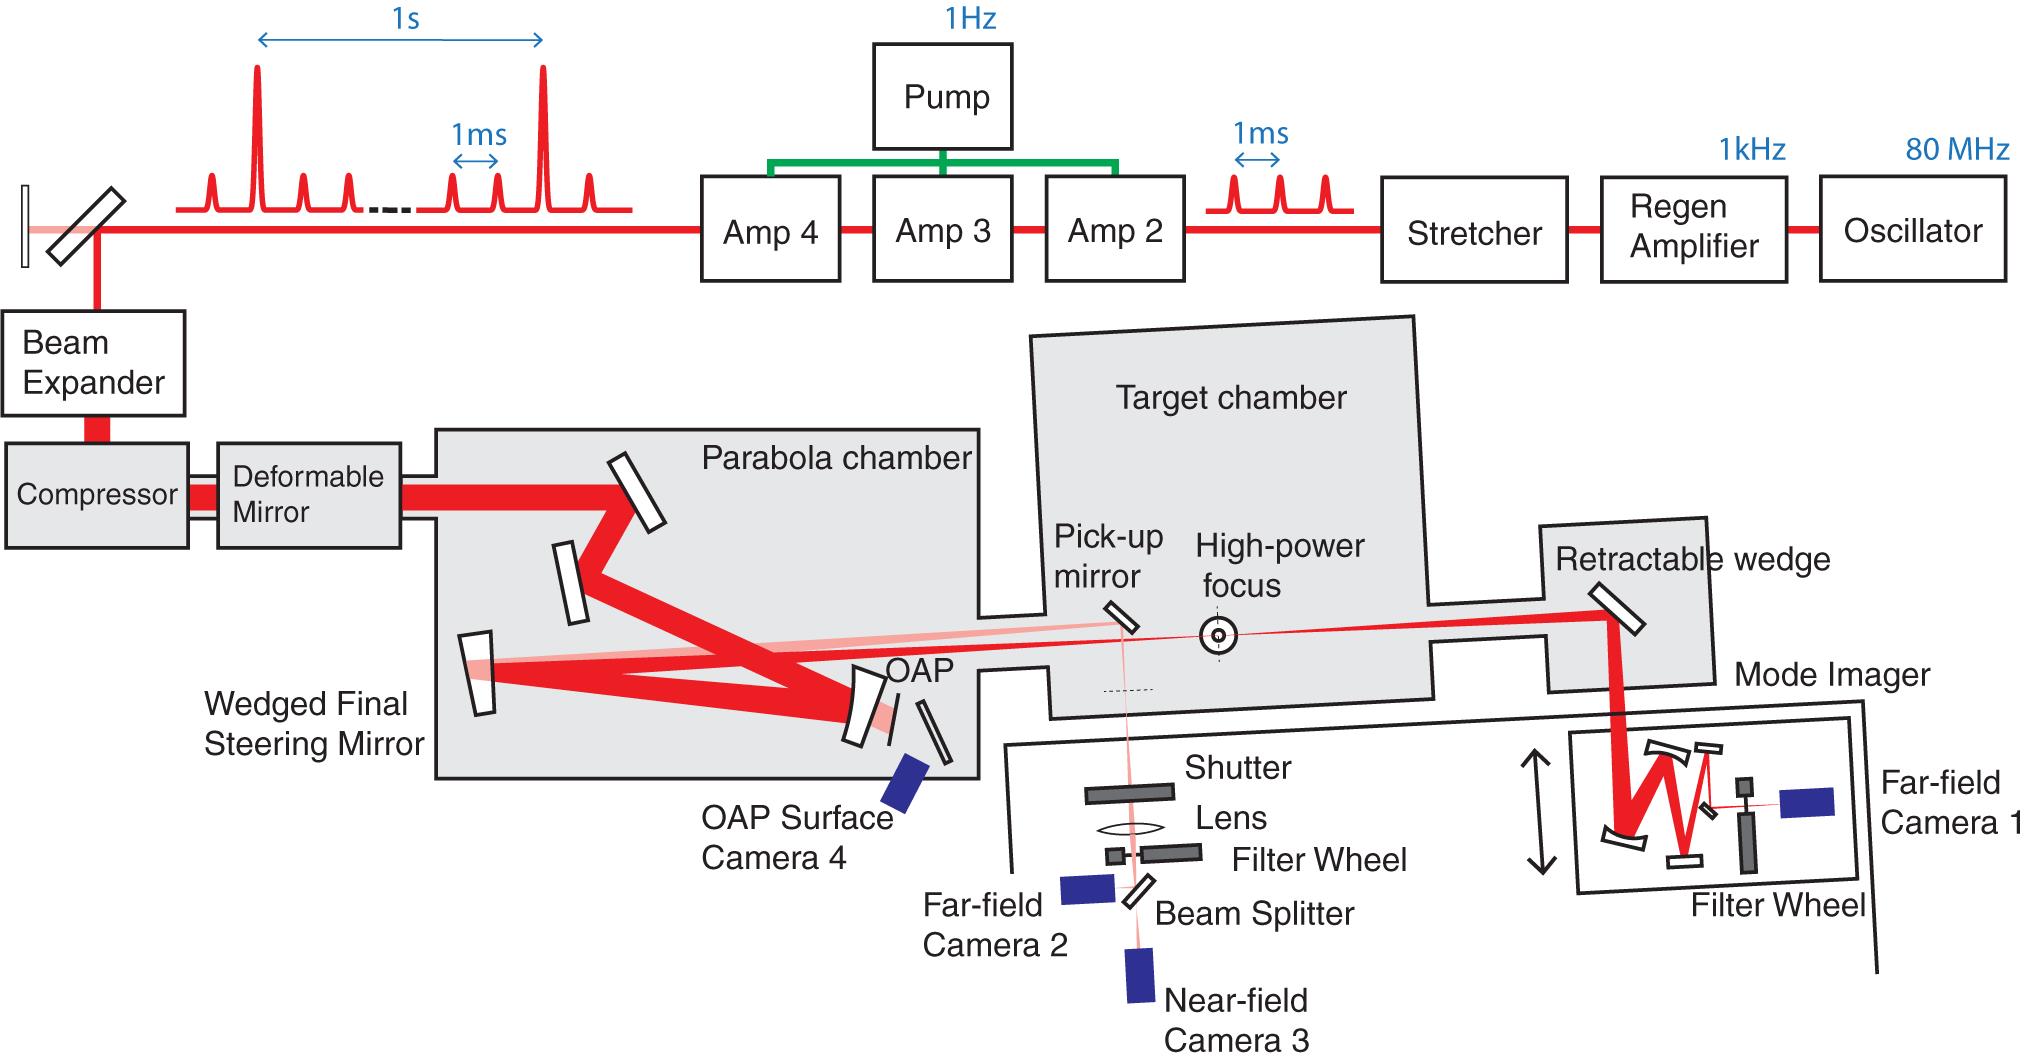
Fig. 1. Experimental setup of the 100-TW-class laser system. A 1 kHz, 800 nm, 35 fs laser pulse train is produced in the regenerative amplifier (Regen) and stretched to 300 ps, and then every one in a thousand pulses is amplified in three successive multi-pass bow-tie amplifiers (Amp 2, 3, and 4). A single commercial pump laser (532 nm, ~16 ns pulse duration) is routed to all three amplifier Ti:sapphire crystals with 1 Hz repetition rate. The laser pulses are then compressed to 35 fs and focused into the target chamber, where a gas jet is placed for LPA experiments. The laser mode at focus is measured with two diagnostics: (1) a common mode imager (after insertion of the retractable wedge) with camera 1 recording the far-field laser profile by imaging the target chamber focus plane; and (2) a correlated witness beam setup, where a back-surface-reflected final steering mirror is routing a correlated copy of the main beam to a setup measuring the laser’s far-field (camera 2, imaging the target chamber focus plane) and quasi-near-field (camera 3, imaging a plane 44 mm downstream of the target chamber focus). The near-field beam profile at the off-axis parabolic mirror (OAP) surface is recorded by camera 4. Gray boxes represent vacuum chambers.
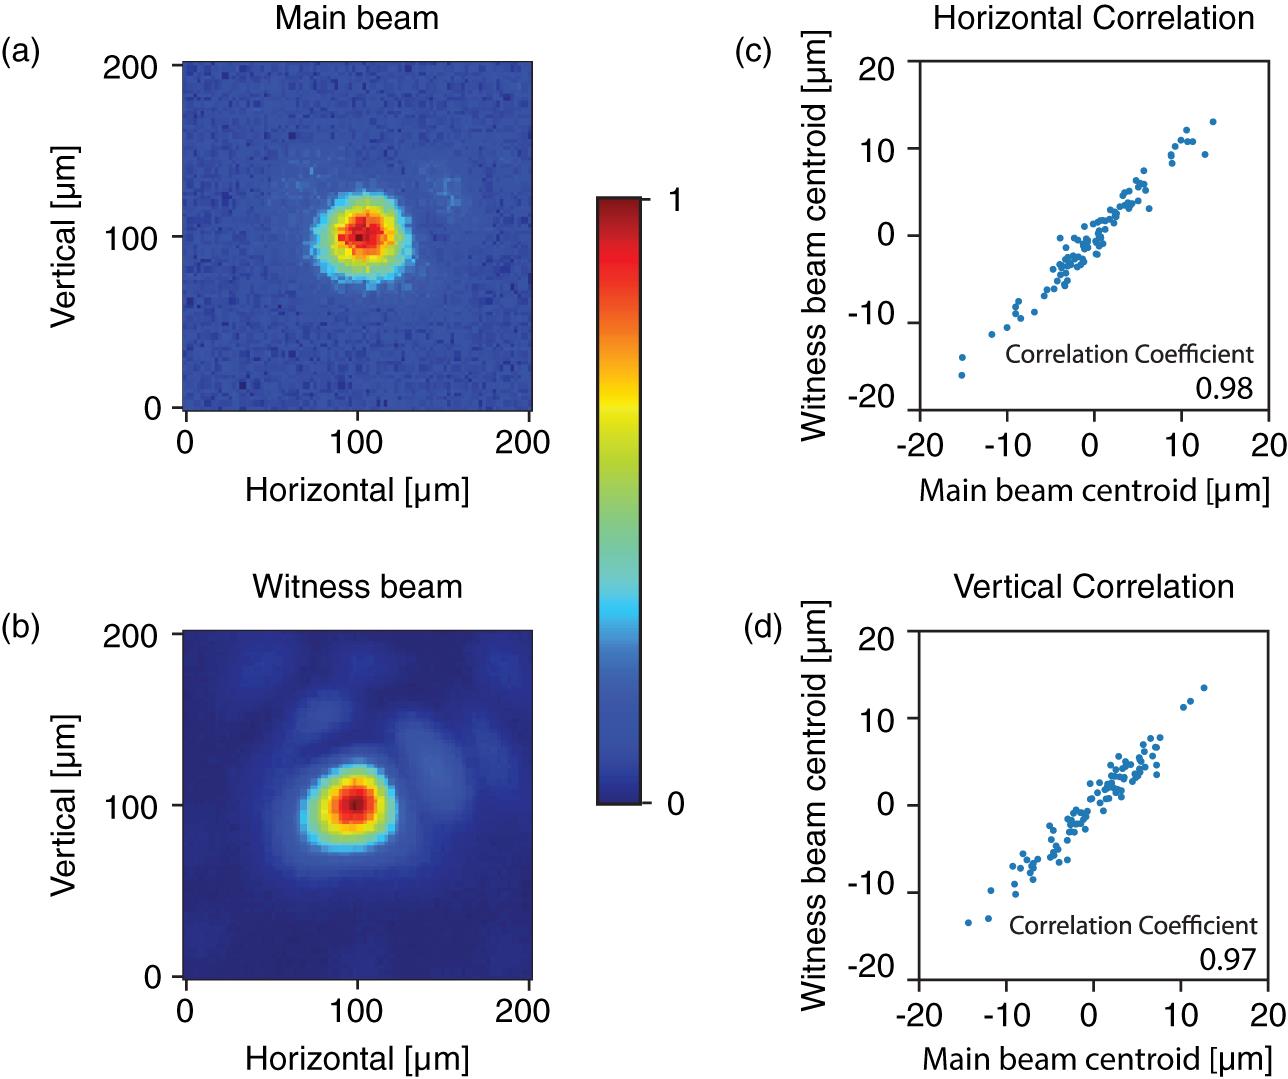
Fig. 2. A single-shot transverse mode profile of the amplified beam captured by (a) camera 1 (mode imager) and (b) camera 2 (witness beam). (c), (d) Correlation of 100 consecutive high-power shots (at 1 Hz) of the main beam and witness beam centroids in horizontal and vertical direction, respectively.
Fig. 3. (a), (b) Time series of 1 kHz non-amplified beam centroids in horizontal and vertical directions measured with far-field witness beam camera 2. The inset displays a zoomed-in sub-set of the first 500 shots. (c), (d) The amplitude  of the discrete Fourier transform
  of the time series (a) and (b), respectively, with
 N = 100,000 the number of samples. In addition to sub-hertz drifts, several peaks in the fluctuation spectrum can be observed between 10 and 100 Hz.
of the discrete Fourier transform of the time series (a) and (b), respectively, with Fig. 4. (a), (b) Time series of 1 kHz non-amplified beam pointing angle at focus in horizontal and vertical directions, derived from the far-field mode captured by camera 2 and the near-field mode captured by camera 3. (c), (d) The amplitude  of the discrete Fourier transform
  of the time series (a) and (b), respectively, highlighting the dominant components below 10 Hz.
of the discrete Fourier transform of the time series (a) and (b), respectively, highlighting the dominant components below 10 Hz. Fig. 5. The standard deviation  of (a) the centroid fluctuations and (b) the angle fluctuations, with only frequencies above
  included in the standard deviation calculation. This representation of the spectral content is a complimentary way to interpret the Fourier transforms of the time series in
 Figures 3 and 4 .
of (a) the centroid fluctuations and (b) the angle fluctuations, with only frequencies above included in the standard deviation calculation. This representation of the spectral content is a complimentary way to interpret the Fourier transforms of the time series in Fig. 6. (a) Illustration of the main beam and the witness beam timing with respect to the camera capture exposure. The example shows the  ms case when camera 1 (mode imager) captures the 1 Hz amplified main beam, whereas camera 2 captures the non-amplified pulse 1 ms earlier. (b) Correlation coefficients
  derived from the beam centroids measured with cameras 1 and 2, both for
  ms (blue bars) and
  ms (orange bars). We observe no significant degradation in
  at
at  ms, indicating that the main pulse has not picked up a random centroid fluctuation during the amplification process.
ms case when camera 1 (mode imager) captures the 1 Hz amplified main beam, whereas camera 2 captures the non-amplified pulse 1 ms earlier. (b) Correlation coefficients derived from the beam centroids measured with cameras 1 and 2, both for ms (blue bars) and ms (orange bars). We observe no significant degradation in at ms, indicating that the main pulse has not picked up a random centroid fluctuation during the amplification process. Fig. 7. (a) Correlations of the main beam centroid at the OAP surface as captured with camera 4, and the pointing angle at focus captured with cameras 2 and 3 (witness beam diagnostic). Camera 4 always captured the main (high-power) 1 Hz pulses, whereas cameras 2 and 3 captured either the same pulse at  ms or the non-amplified pulse 1 ms earlier at
  ms. (b) Correlation coefficients
  for the plots in (a), showing that there are no significant differences in
  between
  ms and
  ms, supporting the claim that the amplification process does not impart significant random fluctuations in the target-chamber laser axis angle.
ms or the non-amplified pulse 1 ms earlier at ms. (b) Correlation coefficients for the plots in (a), showing that there are no significant differences in between ms and ms, supporting the claim that the amplification process does not impart significant random fluctuations in the target-chamber laser axis angle. 
Set citation alerts for the article
Please enter your email address
© Copyright 2018-2021 | Chinese Laser Press. All Rights Reserved 沪ICP备15018463号-20