• Laser & Optoelectronics Progress
  • Vol. 55, Issue 1, 13004 (2018)
Chen Zhikun1, Mi Yang1、*, Shen Xiaowei1, and Cheng Pengfei1、2
Author Affiliations
  • 1College of Electrical Engineering, North China University of Science and Technology, Tangshan, Hebei 0 63210, China
  • 2Measurement Technology and Instrument Key Lab of Hebei Province, Yanshan University, Qinhuangdao, Hebei 0 66004, China
  • show less
    DOI: 10.3788/LOP55.013004 Cite this Article Set citation alerts
    Chen Zhikun, Mi Yang, Shen Xiaowei, Cheng Pengfei. Fluorescence Detection of Oil Pollutants Based on PARAFAC and ART Algorithms[J]. Laser & Optoelectronics Progress, 2018, 55(1): 13004 Copy Citation Text show less
    Model decomposition schematic of PARAFAC algorithm
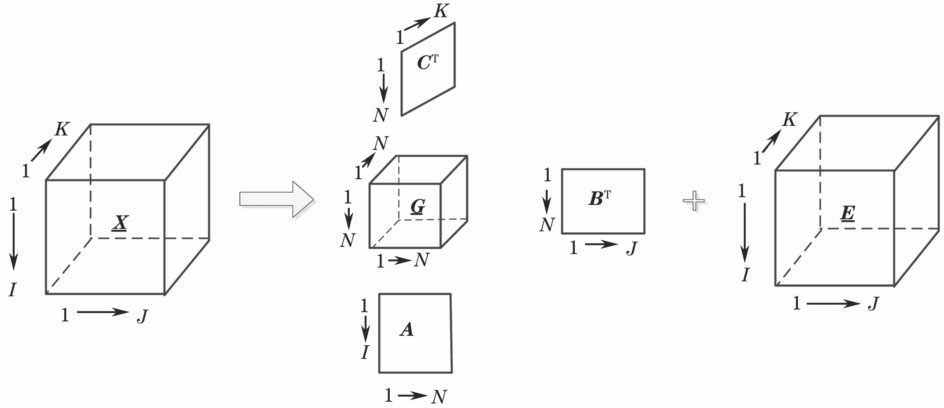
    Fig. 1. Model decomposition schematic of PARAFAC algorithm
    Three-dimensional fluorescence spectra of standard solutions. (a) Diesel; (b) gasoline; (c) kerosene
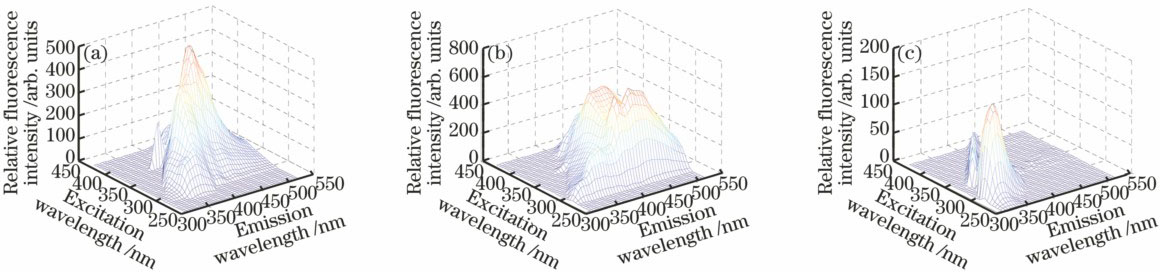
    Fig. 2. Three-dimensional fluorescence spectra of standard solutions. (a) Diesel; (b) gasoline; (c) kerosene
    Two-dimensional fluorescence spectra of diesel, gasoline and kerosene standard solutions. (a) Excitation spectra; (b) emission spectra
    Fig. 3. Two-dimensional fluorescence spectra of diesel, gasoline and kerosene standard solutions. (a) Excitation spectra; (b) emission spectra
    Fluorescence spectra estimated by PARAFAC algorithm model. (a) Excitation spectra; (b) emission spectra
    Fig. 4. Fluorescence spectra estimated by PARAFAC algorithm model. (a) Excitation spectra; (b) emission spectra
    Residual square sum of (a) PARAFAC and (b) ART algorithms changing with component number
    Fig. 5. Residual square sum of (a) PARAFAC and (b) ART algorithms changing with component number
    Fluorescence spectra estimated by ART algorithm. (a) Excitation spectra; (b) emission spectra
    Fig. 6. Fluorescence spectra estimated by ART algorithm. (a) Excitation spectra; (b) emission spectra
    NumberMass concentration /(mg·L-1)NumberMass concentration /(mg·L-1)
    No. 0 dieselNo. 95 gasolineKeroseneNo. 0 dieselNo. 95 gasolineKerosene
    10.20.10.5110.30.30.3
    20.10.50.2120.30.10.5
    30.50.20.1130.50.30.1
    40.50.50.5140.10.50.2
    50.80.80.8150.40.30.2
    61.01.01.0160.70.70.7
    70.50.81.0170.60.90.8
    80.81.00.5180.80.60.7
    91.00.50.8190.90.80.6
    100.81.00.8200.80.90.6
    Table 1. Mass concentration of samples
    NumberPredicted massconcentration /(mg·L-1)Recoveryrate /%Average recoveryrate /%
    No. 0dieselNo. 95gasolineKeroseneNo. 0dieselNo. 95gasolineKeroseneNo. 0dieselNo. 95gasolineKerosene
    110.2870.2790.29095.6793.0096.6795.60±3.6094.67±3.6695.49±4.49
    120.2830.0920.47294.3392.0094.40
    130.4790.2820.09195.8094.0091.00
    140.0920.4850.19392.0097.0096.50
    150.3760.2860.19294.0095.3396.00
    160.6870.6650.67498.1495.0096.29
    170.5750.8700.77895.8396.6797.25
    180.7740.5640.67396.7594.0096.14
    190.8570.7300.56695.2291.2594.33
    200.7860.8850.57898.2598.3396.33
    Table 2. Predicted mass concentration and recovery rate of mixed solutions obtained by PARAFAC algorithm
    NumberPredicted massconcentration /(mg·L-1)Recoveryrate /%Averagerecovery rate /%
    No. 0dieselNo. 95gasolineKeroseneNo. 0dieselNo. 95gasolineKeroseneNo. 0dieselNo. 95gasolineKerosene
    110.2850.2930.26195.0097.6787.0096.58±2.1795.17±9.1795.90±8.90
    120.2890.0860.48496.3386.0096.80
    130.4870.2910.09597.4097.0095.00
    140.0950.4700.20395.0094.00101.50
    150.3850.2730.19096.2591.0095.00
    160.6870.6730.65298.1496.1493.14
    170.5870.8820.77297.8398.0096.50
    180.7600.5790.68295.0096.5097.42
    190.8650.7620.58996.1195.2598.17
    200.7900.9010.59198.75100.1198.50
    Table 3. Predicted mass concentration and recovery rate of mixed solutions obtained by ART algorithm
    Chen Zhikun, Mi Yang, Shen Xiaowei, Cheng Pengfei. Fluorescence Detection of Oil Pollutants Based on PARAFAC and ART Algorithms[J]. Laser & Optoelectronics Progress, 2018, 55(1): 13004
    Download Citation