• Laser & Optoelectronics Progress
  • Vol. 58, Issue 10, 1011024 (2021)
Yan Kang1, Ruikai Xue1、2, Lifei Li1, Tongyi Zhang1、2、*, and Qi Gao1、2
Author Affiliations
  • 1State Key Laboratory of Transient Optics and Photonics, Xi'an Institute of Optics and Precision Mechanics, Chinese Academy of Sciences, Xi'an, Shaanxi 710119, China
  • 2University of Chinese Academy of Sciences, Beijing 100049, China
  • show less
    DOI: 10.3788/LOP202158.1011024 Cite this Article Set citation alerts
    Yan Kang, Ruikai Xue, Lifei Li, Tongyi Zhang, Qi Gao. Coaxial Scanning Three-dimensional Imaging Based on SPAD Array[J]. Laser & Optoelectronics Progress, 2021, 58(10): 1011024 Copy Citation Text show less
    Experimental system structure
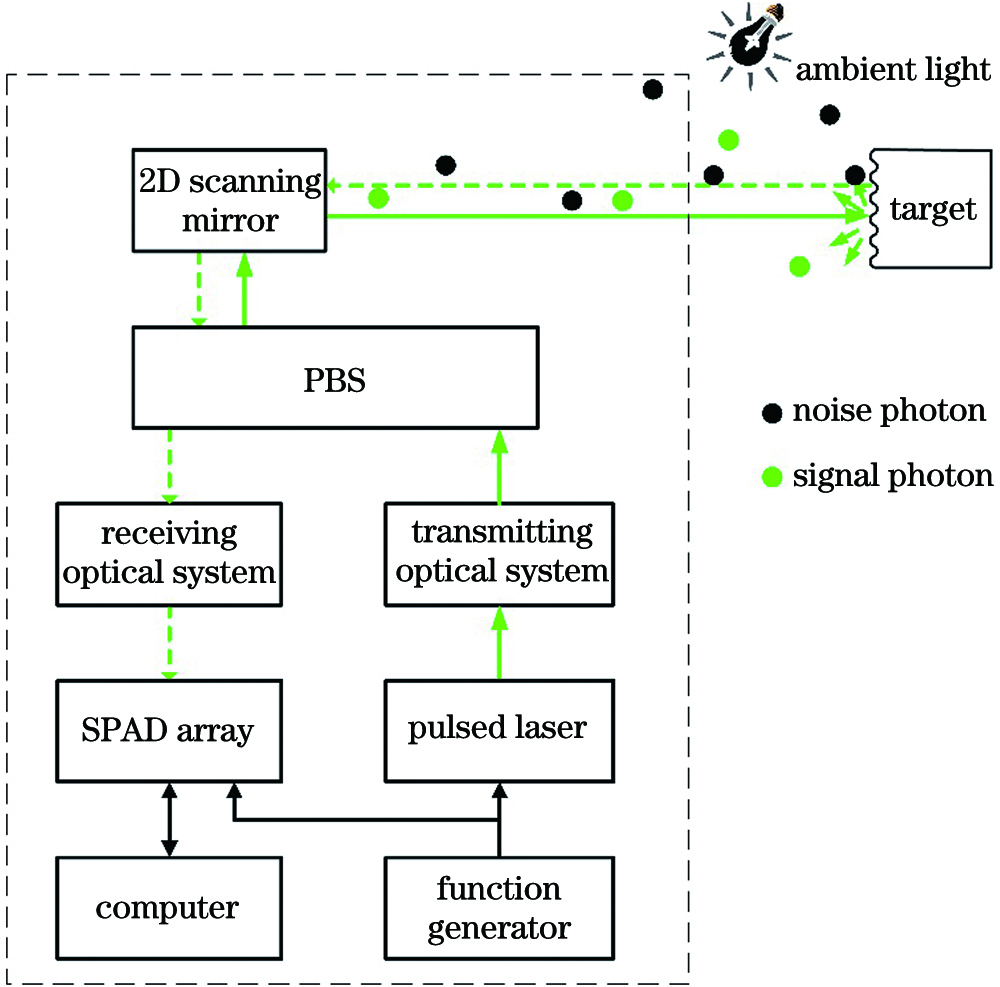
    Fig. 1. Experimental system structure
    Schematic of common path array scanning imaging
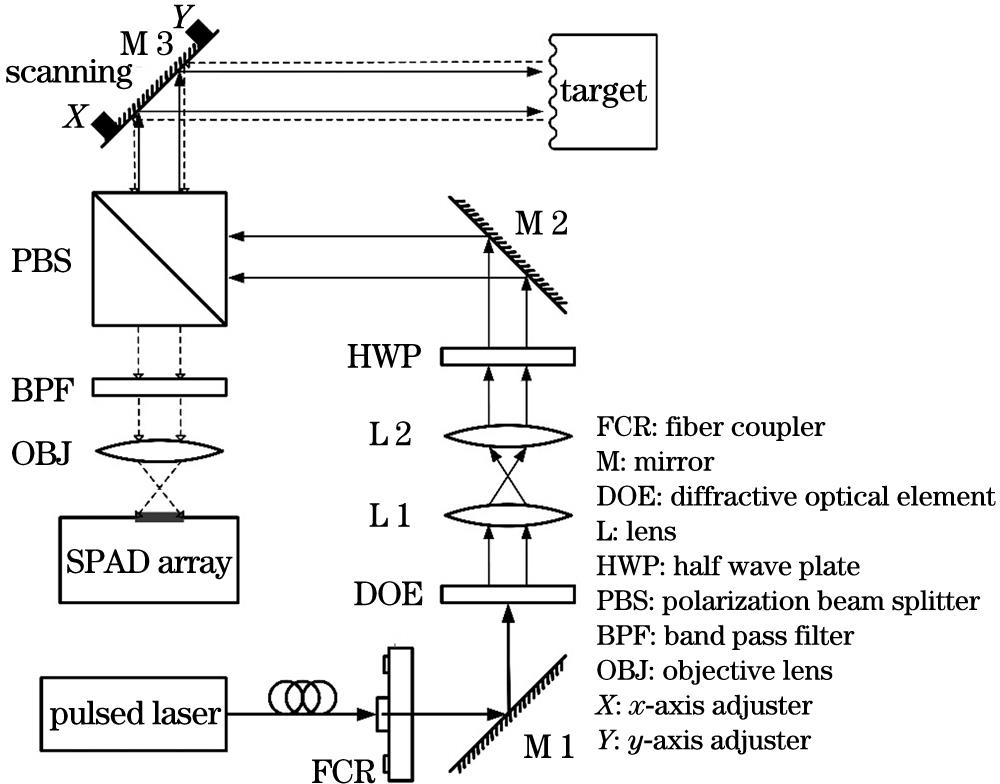
    Fig. 2. Schematic of common path array scanning imaging
    Calibration pattern and its alignment pattern with FOV and laser dot matrix. (a) Calibration pattern; (b) receiving FOV after calibration; (c) illumination dot matrix after calibration
    Fig. 3. Calibration pattern and its alignment pattern with FOV and laser dot matrix. (a) Calibration pattern; (b) receiving FOV after calibration; (c) illumination dot matrix after calibration
    Diagram of FOV deviation in bi-static mode [26]
    Fig. 4. Diagram of FOV deviation in bi-static mode [26]
    Photon count distribution curves of backward reflection and echo signals under different conditions. (a) Front surface of PBS is placed perpendicular to outgoing beam; (b) front surface of PBS is placed at small angle with outgoing beam
    Fig. 5. Photon count distribution curves of backward reflection and echo signals under different conditions. (a) Front surface of PBS is placed perpendicular to outgoing beam; (b) front surface of PBS is placed at small angle with outgoing beam
    Distribution of dark count rate of each pixel in SPAD array. (a) 1st collection; (b) 2nd collection; (c) 3rd collection; (d) 4th collection; (e) 5th collection; (f) distribution of pixels with dark count rate greater than 200 Hz on planar array
    Fig. 6. Distribution of dark count rate of each pixel in SPAD array. (a) 1st collection; (b) 2nd collection; (c) 3rd collection; (d) 4th collection; (e) 5th collection; (f) distribution of pixels with dark count rate greater than 200 Hz on planar array
    1D distribution of dark count rate
    Fig. 7. 1D distribution of dark count rate
    Target scene and imaging results before and after correction. (a) Target scene; (b) distance image before correction; (c) distance image after correction
    Fig. 8. Target scene and imaging results before and after correction. (a) Target scene; (b) distance image before correction; (c) distance image after correction
    Imaging target and experimental site photograph
    Fig. 9. Imaging target and experimental site photograph
    Scanning trace
    Fig. 10. Scanning trace
    Reference ground truth image of target
    Fig. 11. Reference ground truth image of target
    Low resolution and high resolution scan reconstruction distance images. (a) Scanning point 1 in Fig. 10; (b) scanning point 2 in Fig. 10; (c) scanning point 3 in Fig. 10; (d) scanning point 4 in Fig. 10; (e) high resolution distance image obtained by scanning reconstruction
    Fig. 12. Low resolution and high resolution scan reconstruction distance images. (a) Scanning point 1 in Fig. 10; (b) scanning point 2 in Fig. 10; (c) scanning point 3 in Fig. 10; (d) scanning point 4 in Fig. 10; (e) high resolution distance image obtained by scanning reconstruction
    Imaging results under different SPP conditions. (a) 8.49; (b) 4.28; (c) 1.23; (d) 0.86; (e) 0.44
    Fig. 13. Imaging results under different SPP conditions. (a) 8.49; (b) 4.28; (c) 1.23; (d) 0.86; (e) 0.44
    SystemParameterValue
    Emitting pulsed laserWavelength /nm532
    Repetition frequency /MHz20
    Pulse width /ps~70
    Average power /μW20
    DOEBeam splitting32×32
    Divergence angle /(mrad×mrad)59.86×59.86
    Beam expanding systemFocal length of L 1 (f1) /mm40
    Focal length of L 2 (f2) /mm75
    Objective lensFocal length (f3) /mm24--75
    SPAD arrayArray size /(pixel×pixel)32×32
    SPAD active area /μm6.95
    Diameter /μm50
    Pixel pitch /%1.5
    Pixel size /(mm×mm)1.6×1.6
    TDC unitTDC bin size /ps55
    TDC range /ns56.3
    Table 1. Performance parameters of experimental system
    SPP8.494.281.230.860.44
    MAE of traditional method /m0.0960.1970.3250.4020.605
    MAE of proposed method /m0.0080.0100.0150.0160.035
    Table 2. MAE values under different SPP conditions
    Yan Kang, Ruikai Xue, Lifei Li, Tongyi Zhang, Qi Gao. Coaxial Scanning Three-dimensional Imaging Based on SPAD Array[J]. Laser & Optoelectronics Progress, 2021, 58(10): 1011024
    Download Citation