
Wenyu Zhang, Zhouping Su. Design of Free-Form Surface Lens of Extended LED Light Source Based on Two-Dimensional Surface Shape Weighted Superposition[J]. Laser & Optoelectronics Progress, 2022, 59(11): 1122003
- Laser & Optoelectronics Progress
- Vol. 59, Issue 11, 1122003 (2022)
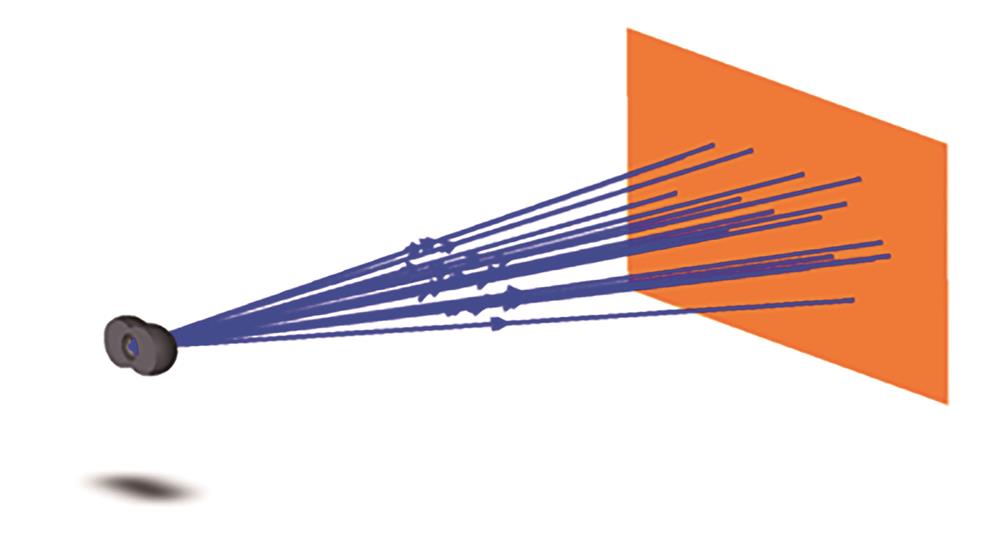
Fig. 1. Diagram of LED illumination system
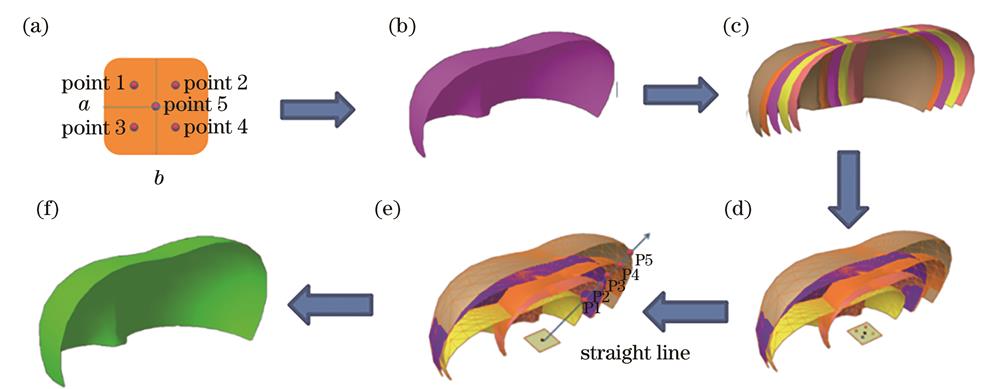
Fig. 2. Schematic diagram of constructing free-form surface by weighted superposition algorithm
Fig. 3. Center coordinate points of surface after translation
Fig. 4. Diagram of intersection of ray and triangular mesh. (a) Triangle mesh surface; (b) intersection of line and triangle surface
Fig. 5. Diagram of intersection of rays and five free-form surfaces. (a) Single ray intersecting with five free-form surfaces; (b) k rays intersecting with five free-form surfaces
Fig. 6. Free-form surface data points after superposition
Fig. 7. Flow chart of optimization algorithm
Fig. 8. Schematic diagram of LED illumination system with key parameters
Fig. 9. Free-form surface after optimization
Fig. 10. Distributions of target surface illuminance before and after optimization. (a) Distribution of illuminance before optimization; (b) contour distribution of illuminance before optimization; (c) distribution of initial weight illuminance; (d) contour distribution of initial weight illuminance; (e) distribution of illuminance after optimization; (f) contour distribution of illuminance after optimization
|
Table 1. Design parameters
|
Table 2. Weight factors before and after optimization
|
Table 3. Optimization results of different initial weight factors

Set citation alerts for the article
Please enter your email address
© Copyright 2018-2021 | Chinese Laser Press. All Rights Reserved 沪ICP备15018463号-20