• Journal of Natural Resources
  • Vol. 35, Issue 11, 2744 (2020)
Yong-yuan HUANG and Sheng-jun ZHU*
Author Affiliations
  • Department of Urban and Regional Planning, Peking University, Beijing 100871, China
  • show less
    DOI: 10.31497/zrzyxb.20201114 Cite this Article
    Yong-yuan HUANG, Sheng-jun ZHU. Public environmental concerns, environmental regulations and energy-intensive industrial dynamics in China[J]. Journal of Natural Resources, 2020, 35(11): 2744 Copy Citation Text show less
    The driving forces of energy-intensive industry dynamics
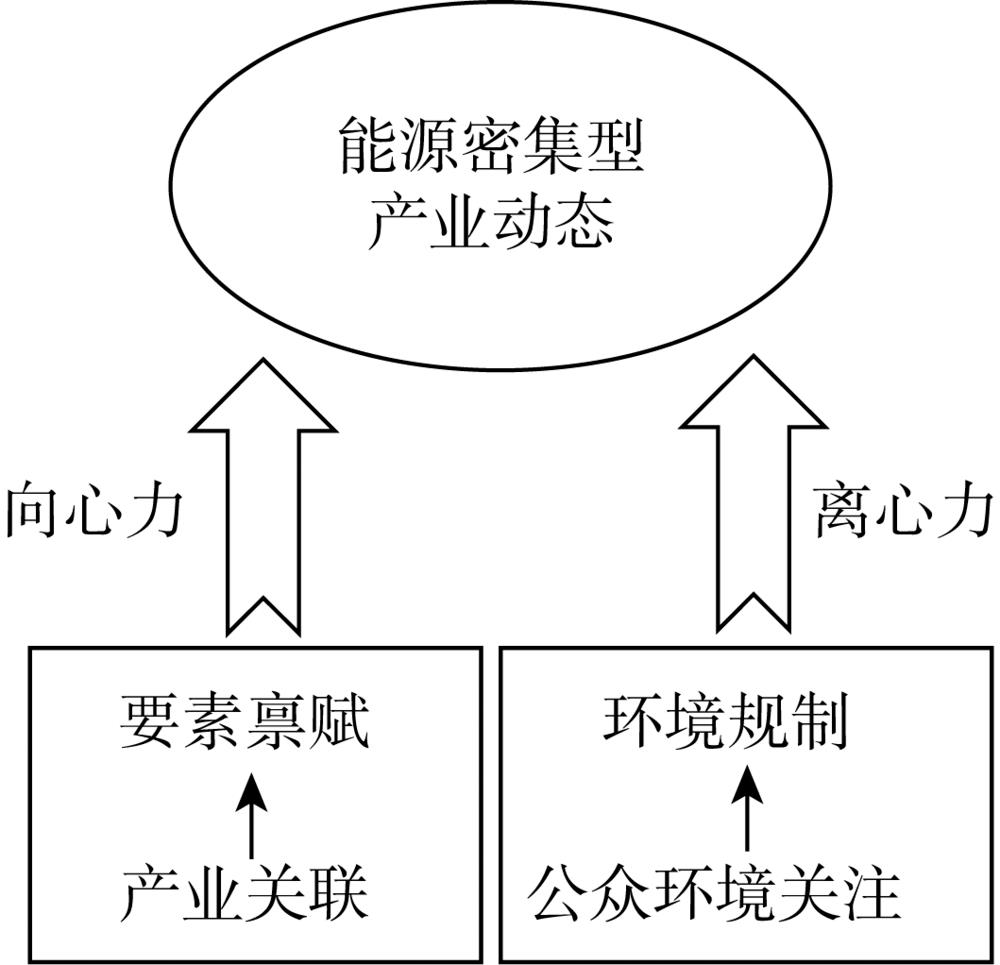
    Fig. 1. The driving forces of energy-intensive industry dynamics
    Distribution of export value of energy-intensive industries in 2011 and 2016
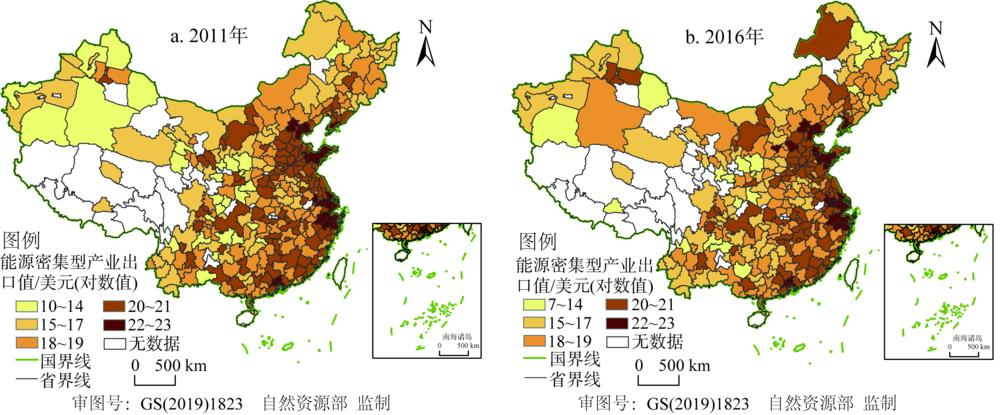
    Fig. 2. Distribution of export value of energy-intensive industries in 2011 and 2016
    Structure of energy-intensive industries from 2011 to 2016
    Fig. 3. Structure of energy-intensive industries from 2011 to 2016
    Structure of energy-intensive industries of seven regions in 2011 and 2016
    Fig. 4. Structure of energy-intensive industries of seven regions in 2011 and 2016
    Distribution of entry rates of energy-intensive industries from 2011 to 2016
    Fig. 5. Distribution of entry rates of energy-intensive industries from 2011 to 2016
    Distribution of public environmental pressure index in 2011 and 2015
    Fig. 6. Distribution of public environmental pressure index in 2011 and 2015
    指标含义指标选取指标来源
    公众环境关注环境关注度百度指数百度指数官方网站
    非正式环境规制环境投诉电话或网络投诉数量《中国环境统计年鉴》
    环境建议与提案人大建议和政协提案数量《中国环境统计年鉴》
    正式环境规制环境法规现行有效的地方性环境法规和政府规章总数量《中国环境统计年鉴》
    环境规制执行企业环境违规数量公众环境研究中心官方网站
    Table 1. The core variables
    省(市、自治区)2012年2014年2016年变化趋势
    江苏省20.5920.3519.46
    广东省13.7712.6112.77
    上海市11.319.798.79
    浙江省10.7510.6711.80
    山东省9.7010.5512.25
    河北省4.515.145.09
    福建省3.803.733.59
    北京市3.442.802.46
    辽宁省3.113.483.45
    河南省2.122.152.13
    江西省2.111.861.88
    湖北省1.892.122.41
    天津市1.692.222.17
    四川省1.661.441.43
    安徽省1.461.781.92
    湖南省1.451.671.22
    重庆市1.121.250.92
    山西省1.051.411.30
    广西壮族自治区0.910.760.77
    陕西省0.750.390.58
    Table 2. The proportion of export value of energy-intensive industries in main provinces (%)
    (1)(2)(3)(4)(5)
    EntryEntryEntryEntryEntry
    Density16.12***16.15***16.12***16.23***16.17***
    Ee12.26**12.18**12.28**11.85**11.32**
    Op0.01410.01430.01440.01660.0172
    Gov0.983***0.981***0.983***0.982***0.960***
    Tp-0.645-0.650-0.645-0.536-0.702
    Tec0.02200.02330.02210.04670.00670
    Lar0.04360.04170.04170.03750.0254
    At-0.549**-0.545**-0.549**-0.499*-0.569**
    Ep1-0.214**
    Ep2-0.0837
    Er1-0.781***
    Er2-0.364***
    常数项-6.688***-6.361**-6.614***-7.420***-5.766**
    Log likelihood-44845.564-44842.861-44845.375-44835.363-44347.211
    Pseudo R20.2160.2160.2160.2160.214
    产业固定效应IncludedIncludedIncludedIncludedIncluded
    城市固定效应IncludedIncludedIncludedIncludedIncluded
    年份固定效应IncludedIncludedIncludedIncludedIncluded
    两控区政策固定效应IncludedIncludedIncludedIncludedIncluded
    N347931347931347931347931347931
    Table 3. The empirical results (1)
    (1)(2)(3)(4)
    EntryEntryEntryEntry
    At0.177-0.514*-0.3823.451**
    Ep1-0.05910.149**
    Er1-0.487**-0.127**
    Er2-0.229*-0.067**
    At×Ep1-0.493***-0.438***
    At×Er1-1.098***-0.220
    At×Er2-0.358*0.262***
    常数项-6.735***-7.979***-5.921**-16.460
    Log likelihood-44831.657-44829.753-44345.723-33432.111
    Pseudo R20.2160.2140.2160.153
    控制变量IncludedIncludedIncludedIncluded
    产业固定效应IncludedIncludedIncludedIncluded
    城市固定效应IncludedIncludedIncludedIncluded
    年份固定效应IncludedIncludedIncludedIncluded
    两控区政策固定效应IncludedIncludedIncludedIncluded
    N347931347931347931347931
    Table 4. The empirical results (2)
    Yong-yuan HUANG, Sheng-jun ZHU. Public environmental concerns, environmental regulations and energy-intensive industrial dynamics in China[J]. Journal of Natural Resources, 2020, 35(11): 2744
    Download Citation