
M. Y. Shubar, H. L. Saadon, Saeed J. Abbas. Nonlinear optical switching and all-figures of merit in Bi2S3-xSex/PMMA nanocomposite films investigated by Z scan under visible CW laser[J]. Chinese Optics Letters, 2020, 18(1): 011902
- Chinese Optics Letters
- Vol. 18, Issue 1, 011902 (2020)
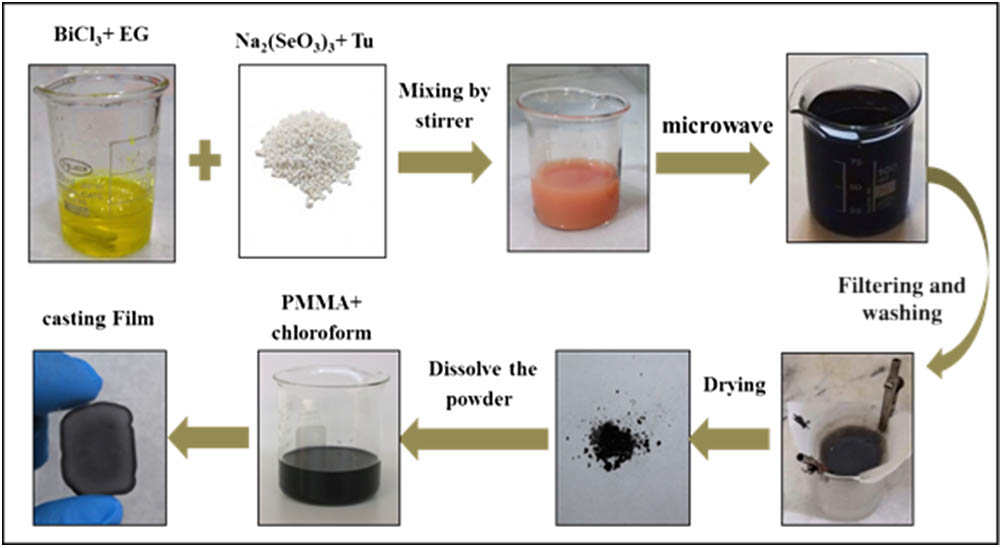
Fig. 1. Schematic steps of the sample preparation process.
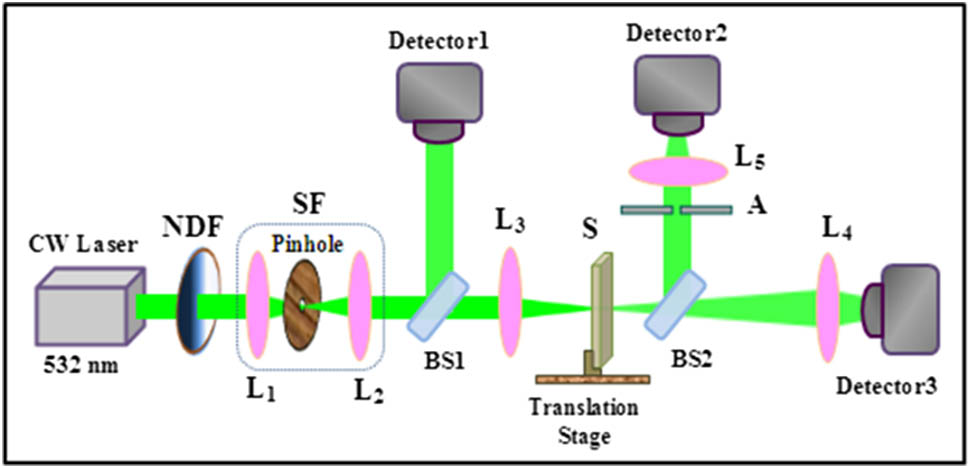
Fig. 2. Experimental setup of Z-scan technique. NDF, natural density filter; L, lens; SF, spatial filter; S, sample; A, aperture.
Fig. 3. (a) X-ray diffraction patterns of
Fig. 4. SEM images of
Fig. 5. EDX spectrum of
Fig. 6. Optical absorption spectra of
Fig. 7. (I) Closed-aperture and (II) open-aperture Z-scan results at different input powers of the
| |||||||||||||||||||||||||||||||||||||||||||||||||||||||||||||||||||||||||||||||||||||||||||||||||||||||||||||||||||||
Table 1. Nonlinear Optical Coefficients and Figures of Merit of Bi2S3−xSex/PMMA Nanocomposite Films with Four Different Compositions of 0, 0.2, 0.4, and 1 at 532 nm Laser Excitation

Set citation alerts for the article
Please enter your email address
© Copyright 2018-2021 | Chinese Laser Press. All Rights Reserved 沪ICP备15018463号-20