• Journal of Geographical Sciences
  • Vol. 30, Issue 6, 988 (2020)
Guining ZHAO1, Zhengyong ZHANG1、*, Lin LIU1, Zhongqin LI1、2, Puyu WANG2, and Liping XU1
Author Affiliations
  • 1. College of Sciences, Shihezi University, Shihezi 832000, Xinjiang, China
  • 2. State Key Laboratory of Cryospheric Science, Northwest Institute of Eco-Environment and Resources, CAS, Lanzhou 730000, China
  • show less
    DOI: 10.1007/s11442-020-1766-z Cite this Article
    Guining ZHAO, Zhengyong ZHANG, Lin LIU, Zhongqin LI, Puyu WANG, Liping XU. Simulation and construction of the glacier mass balance in the Manas River Basin, Tianshan, China from 2000 to 2016[J]. Journal of Geographical Sciences, 2020, 30(6): 988 Copy Citation Text show less
    Location of the Manas River Basin
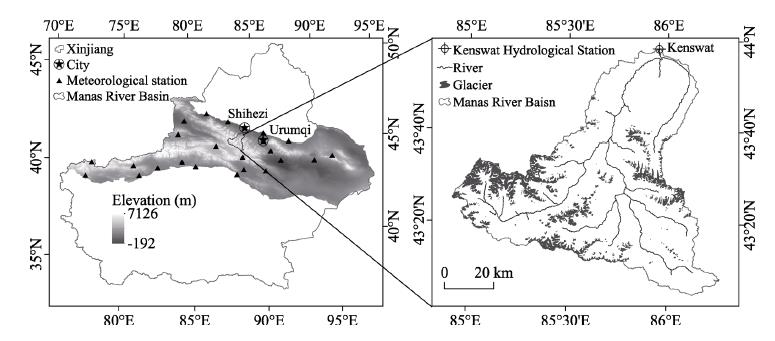
    Fig. 1. Location of the Manas River Basin
    Annual average temperature and annual precipitation, and monthly average temperature and precipitation in the glacier ablation period for the Manas River Basin
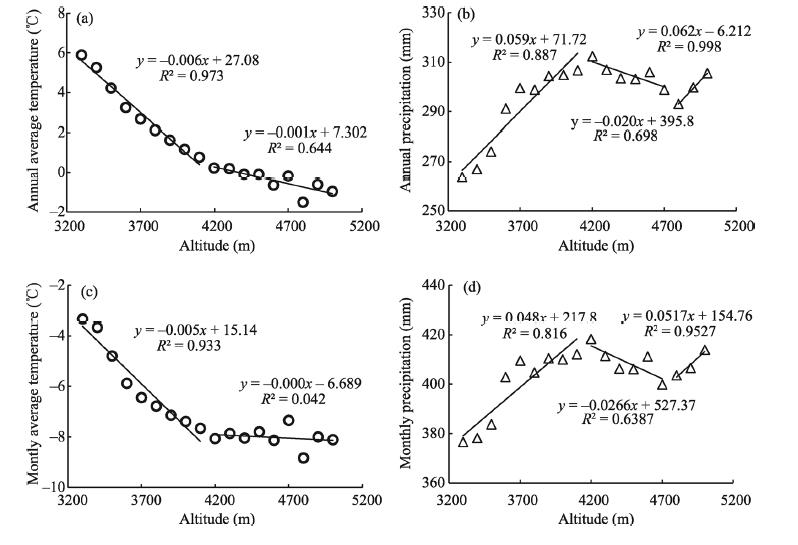
    Fig. 2. Annual average temperature and annual precipitation, and monthly average temperature and precipitation in the glacier ablation period for the Manas River Basin
    Interannual GMB anomalies with cumulative anomalies and the monthly GMB with runoff in the Manas River Basin
    Fig. 3. Interannual GMB anomalies with cumulative anomalies and the monthly GMB with runoff in the Manas River Basin
    The values for the GMB in each elevation zone in the Manas River Basin
    Fig. 4. The values for the GMB in each elevation zone in the Manas River Basin
    Changes for the ice and snow degree-day factors in the Manas River Basin
    Fig. 5. Changes for the ice and snow degree-day factors in the Manas River Basin
    CategoryTimeResolutionOfficial website
    NDVI2000-2016250 m × 250 mNASA (https://www.nasa.gov/)
    MOD11C30.05° × 0.05°
    TRMM 3B430.25° × 0.25°
    DEM201030 m × 30 mGeospatial Data Cloud (http://www.gscloud.cn/)
    Temperature2000-2016National Meteorological Information Center (http://data.cma.cn/)
    Precipitation
    Glacier area2006-2010Scientific Data Center for Cold and Arid Regions (http://westdc.westgis.ac.cn/)
    Snow density2014Document (Chenet al., 2015)
    Runoff2000-2016Kenswat Hydrological Station
    Table 1.

    Data sources

    MonthRegression factor coefficientAccuracy
    λabcdefgRMSER2
    15.411.12-0.64-0.00200.2100.01103.891.573.060.89
    256.48-0.47-0.41-0.00400.2600.01018.971.381.780.94
    3121.38-2.05-0.26-0.00700.2200.013015.431.222.880.95
    4143.06-2.54-0.11-0.01200.1700.00606.880.841.820.94
    5140.79-2.31-0.05-0.01000.1700.0043-1.610.761.160.95
    6127.95-1.80-0.04-0.01300.1360.0080-4.570.631.160.96
    7108.19-1.36-0.04-0.01300.1200.0120-5.250.661.420.96
    8109.65-1.40-0.05-0.01300.1200.0110-5.250.631.160.94
    9111.77-1.70-0.04-0.00900.1600.0101-3.000.721.300.92
    1081.19-1.35-0.10-0.00580.2080.00586.031.061.150.89
    1148.80-0.57-0.25-0.00340.2400.01109.491.181.270.90
    1251.620.26-0.71-0.00300.2800.0120-14.490.621.520.90
    Table 2.

    Coefficients and accuracy of the monthly temperature regression model

    MonthRegression factor coefficientAccuracy
    λabcdefgRMSER2
    119.27-1.150.34-0.00210.0490.0036-1.861.153.690.74
    242.42-2.330.68-0.00300.136-0.0020-38.851.189.310.76
    3-60.871.320.04-0.0018-0.0060.01054.371.036.750.81
    4158.81-4.820.65-0.01130.1080.0011-29.91.6410.330.85
    563.84-2.640.66-0.00530.065-0.0054-24.151.3113.200.85
    6-149.022.600.440.0095-0.014-0.0289-19.101.0114.410.88
    7-174.732.970.470.01450.106-0.0261-11.220.9714.330.83
    8-83.761.290.260.01130.072-0.0201-11.611.1119.690.84
    9-25.691.09-0.270.0001-0.0270.0172-20.521.518.430.82
    1038.290.60-0.72-0.00340.0380.0143-8.000.918.420.85
    1160.39-1.920.28-0.00470.035-0.0002-5.511.129.080.78
    12-4.97-0.060.10-0.00240.0010.0007-6.950.934.290.71
    Table 3.

    Coefficients and accuracy of the monthly precipitation regression model

    YearELA (m)GMB (mm.w.e.)Glacier meltwater (108 m3)River runoff (108 m3)Recharge rate of glacier meltwater
    20004538-545.863.2916.290.20
    20014550-566.882.9914.430.21
    20024530-551.413.5118.740.19
    20034558-584.203.2211.050.29
    20044560-620.493.4712.280.28
    20054532-575.593.3713.390.25
    20064588-632.193.6313.180.28
    20074537-602.903.6815.470.24
    20084569-624.723.2713.770.24
    20094507-464.852.9111.000.26
    20104533-527.053.3616.620.20
    20114560-602.953.6511.740.31
    20124555-597.013.4612.540.28
    20134553-587.423.4113.370.25
    20144556-563.953.2110.650.30
    20154573-605.614.0118.350.22
    20164528-558.113.4815.450.23
    Average4549-577.133.4114.020.25
    Table 4.

    The GMB, glacier meltwater and recharge rates in the MRB during 2000-2016

    RegionFitting equationCorrelation
    Ablation areay1 = 2.4483x - 10729R² = 0.927
    Accumulation areay2 = 0.1877x - 788.3R² = 0.073
    Glacier region (whole)y3 = 1.7909x - 2522.5 (linear)R² = 0.873
    y4 = -0.0014x2 +13.75x - 32691 (non-linear)R² = 0.993
    Table 5.

    Variation of the fitting curves of the GMB with altitude in the glacier zones

    Guining ZHAO, Zhengyong ZHANG, Lin LIU, Zhongqin LI, Puyu WANG, Liping XU. Simulation and construction of the glacier mass balance in the Manas River Basin, Tianshan, China from 2000 to 2016[J]. Journal of Geographical Sciences, 2020, 30(6): 988
    Download Citation