
Guining ZHAO, Zhengyong ZHANG, Lin LIU, Zhongqin LI, Puyu WANG, Liping XU. Simulation and construction of the glacier mass balance in the Manas River Basin, Tianshan, China from 2000 to 2016[J]. Journal of Geographical Sciences, 2020, 30(6): 988
- Journal of Geographical Sciences
- Vol. 30, Issue 6, 988 (2020)
Abstract
Keywords
1 Introduction
Against a background of global warming, glaciers as “solid reservoirs” are being strongly affected by climate change. While mountain glaciers located in mid-low latitudes are more sensitive to climate change (
Glacier meltwater in the Tianshan Mountains plays a supporting role in oasis economic development and ecological construction. At present, the studies of the GMB in the Tianshan Mountains are not limited to typical glaciers (
2 Study area
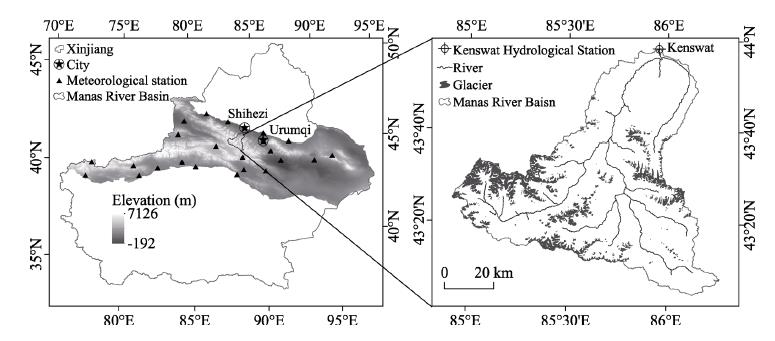
The MRB (43°27’-45°21’N, 85°01’-86°32’E), located in the southern Dzungaria Basin of the northern Tianshan Mountains (
![]()
Figure 1.
3 Data and methods
3.1 Data
The data include mainly multi-source remote sensing data and measured meteorological and hydrological data (
| Category | Time | Resolution | Official website |
|---|---|---|---|
| NDVI | 2000-2016 | 250 m × 250 m | NASA (https://www.nasa.gov/) |
| MOD11C3 | 0.05° × 0.05° | ||
| TRMM 3B43 | 0.25° × 0.25° | ||
| DEM | 2010 | 30 m × 30 m | Geospatial Data Cloud (http://www.gscloud.cn/) |
| Temperature | 2000-2016 | National Meteorological Information Center (http://data.cma.cn/) | |
| Precipitation | |||
| Glacier area | 2006-2010 | Scientific Data Center for Cold and Arid Regions (http://westdc.westgis.ac.cn/) | |
| Snow density | 2014 | Document (Chen | |
| Runoff | 2000-2016 | Kenswat Hydrological Station |
Table 1.
Data sources
3.2 Methods
The downscaled inversion MOD11C3 and TRMM 3B43 data were used to run the degree-day model to simulate the GMB in the MRB from 2000 to 2016. First, the inversion models between the measured and the remote sensing meteorological data were constructed with other terrain impact factors to improve the accuracy of the temperature and precipitation data for the Tianshan Mountains. Second, the temperature and precipitation inversion data were downscaled by DEM data to a resolution of 30 m × 30 m. Then, the recalculated meteorological data were evaluated using the Root Mean Square Error (RMSE) and coefficient of determination (R2) values. Finally, MOD11C3 and TRMM 3B43 data that met the requirements of precision and resolution were input into the degree-day model to simulate change of the GMB in the MRB.
3.2.1 Construction of temperature and precipitation inversion models
Climate factors play a decisive role in the change of the GMB. However, the complex geographical environment in alpine areas restricts effective long-term climate monitoring. To describe climate characteristics objectively in the glacier area, MOD11C3 and TRMM 3B43 data were used to replace the traditional monitoring meteorological data. Due to the limitations of the topography or the sensors, remote sensing meteorological products are prone to problems such as “high-value underestimation” or “low-value overestimation” (
There is only one national meteorological station (Shihezi) located close to the study area. Ideally, to achieve accuracy in the inversion models, the study range should be expanded to include the 23 meteorological stations in the Tianshan Mountains. The monthly temperature and precipitation regression models were established between the monthly multi-source remote sensing data and the monthly measured meteorological data (Equation 1). The monthly coefficients for the regression model are shown in Tables 2 and 3, and the RMSE and R2 values were used to evaluate the applicability of the inversion models and the accuracy of the recalculated temperature and precipitation inversion values. The RMSE can give a measure of the degree of dispersion between the inversion and the measured data, and R2 can reflect their correlation. Thus the smaller the RMSE and the larger the R2 values are, the stronger is the applicability of the inversion models and the higher the accuracy of the inversion results. The monthly average temperature regression models (
| Month | Regression factor coefficient | Accuracy | ||||||||
|---|---|---|---|---|---|---|---|---|---|---|
| λ | a | b | c | d | e | f | g | RMSE | ||
| 1 | 5.41 | 1.12 | -0.64 | -0.0020 | 0.210 | 0.0110 | 3.89 | 1.57 | 3.06 | 0.89 |
| 2 | 56.48 | -0.47 | -0.41 | -0.0040 | 0.260 | 0.0101 | 8.97 | 1.38 | 1.78 | 0.94 |
| 3 | 121.38 | -2.05 | -0.26 | -0.0070 | 0.220 | 0.0130 | 15.43 | 1.22 | 2.88 | 0.95 |
| 4 | 143.06 | -2.54 | -0.11 | -0.0120 | 0.170 | 0.0060 | 6.88 | 0.84 | 1.82 | 0.94 |
| 5 | 140.79 | -2.31 | -0.05 | -0.0100 | 0.170 | 0.0043 | -1.61 | 0.76 | 1.16 | 0.95 |
| 6 | 127.95 | -1.80 | -0.04 | -0.0130 | 0.136 | 0.0080 | -4.57 | 0.63 | 1.16 | 0.96 |
| 7 | 108.19 | -1.36 | -0.04 | -0.0130 | 0.120 | 0.0120 | -5.25 | 0.66 | 1.42 | 0.96 |
| 8 | 109.65 | -1.40 | -0.05 | -0.0130 | 0.120 | 0.0110 | -5.25 | 0.63 | 1.16 | 0.94 |
| 9 | 111.77 | -1.70 | -0.04 | -0.0090 | 0.160 | 0.0101 | -3.00 | 0.72 | 1.30 | 0.92 |
| 10 | 81.19 | -1.35 | -0.10 | -0.0058 | 0.208 | 0.0058 | 6.03 | 1.06 | 1.15 | 0.89 |
| 11 | 48.80 | -0.57 | -0.25 | -0.0034 | 0.240 | 0.0110 | 9.49 | 1.18 | 1.27 | 0.90 |
| 12 | 51.62 | 0.26 | -0.71 | -0.0030 | 0.280 | 0.0120 | -14.49 | 0.62 | 1.52 | 0.90 |
Table 2.
Coefficients and accuracy of the monthly temperature regression model
| Month | Regression factor coefficient | Accuracy | ||||||||
|---|---|---|---|---|---|---|---|---|---|---|
| λ | a | b | c | d | e | f | g | RMSE | ||
| 1 | 19.27 | -1.15 | 0.34 | -0.0021 | 0.049 | 0.0036 | -1.86 | 1.15 | 3.69 | 0.74 |
| 2 | 42.42 | -2.33 | 0.68 | -0.0030 | 0.136 | -0.0020 | -38.85 | 1.18 | 9.31 | 0.76 |
| 3 | -60.87 | 1.32 | 0.04 | -0.0018 | -0.006 | 0.0105 | 4.37 | 1.03 | 6.75 | 0.81 |
| 4 | 158.81 | -4.82 | 0.65 | -0.0113 | 0.108 | 0.0011 | -29.9 | 1.64 | 10.33 | 0.85 |
| 5 | 63.84 | -2.64 | 0.66 | -0.0053 | 0.065 | -0.0054 | -24.15 | 1.31 | 13.20 | 0.85 |
| 6 | -149.02 | 2.60 | 0.44 | 0.0095 | -0.014 | -0.0289 | -19.10 | 1.01 | 14.41 | 0.88 |
| 7 | -174.73 | 2.97 | 0.47 | 0.0145 | 0.106 | -0.0261 | -11.22 | 0.97 | 14.33 | 0.83 |
| 8 | -83.76 | 1.29 | 0.26 | 0.0113 | 0.072 | -0.0201 | -11.61 | 1.11 | 19.69 | 0.84 |
| 9 | -25.69 | 1.09 | -0.27 | 0.0001 | -0.027 | 0.0172 | -20.52 | 1.51 | 8.43 | 0.82 |
| 10 | 38.29 | 0.60 | -0.72 | -0.0034 | 0.038 | 0.0143 | -8.00 | 0.91 | 8.42 | 0.85 |
| 11 | 60.39 | -1.92 | 0.28 | -0.0047 | 0.035 | -0.0002 | -5.51 | 1.12 | 9.08 | 0.78 |
| 12 | -4.97 | -0.06 | 0.10 | -0.0024 | 0.001 | 0.0007 | -6.95 | 0.93 | 4.29 | 0.71 |
Table 3.
Coefficients and accuracy of the monthly precipitation regression model
where y is the measured temperature or precipitation, λ is the intercept, x1 is the latitude, x2 is the longitude, x3 is the altitude, x4 is the slope, x5 is the aspect, x6 is the NDVI, x7 is MOD11C3 or TRMM 3B43. The terms a, b, c, d, e, f and g are regression coefficients.
Although it is believed that remote sensing meteorological data can objectively depict the climate characteristics in mountainous regions, the basin-scale simulation of the GMB still cannot meet input requirements of the degree-day model. Generally, further downscaling methods may be used to improve the spatial resolution of remote sensing data to achieve fine detail of the local climate (
3.2.2 Description of the degree-day model
For glacier and snow melting, the amount of melting in a certain period is given by (
where A is the melt water equivalent of glacier ice and snow in a certain period (mm w.e), D is the degree-day factor of glacier ice/snow (mm/(℃·d)), and PDD is the cumulative positive temperature in a certain period (℃), which can be obtained by (
where Tm (℃) is the average monthly temperature and presents a normal distribution over the year, Ta is the average yearly temperature (℃), δ is the standard deviation of the temperature distribution, N1 and N2 are the start and end dates for the calculation and the time interval is N = N2 - N1 + 1.
The net GMB at a certain point (or altitude) (
where Bi is the GMB (mm w.e.) in a certain period, P is glacier surface accumulation by solid precipitation (mm w.e.) in a certain period, A is glacier ablation (mm w.e.), and f is glacier meltwater refreezing rate or internal replenishment (mm w.e.) usually calculated as 10% of the amount melted (
Solid precipitation can be calculated by the double critical temperature method (
where PS and PL are the solid and liquid precipitation (mm), P is the total monthly precipitation (mm), T is the average monthly temperature (℃), TS and TL are the critical temperatures of solid and liquid precipitation (℃), taken as -0.5℃ and 2℃, respectively, and determined according to the observation data of the Urumqi glacier No.1 in the Tianshan Mountains (
The GMB of the entire glacier is (
where Si is the glacier area of each glacier band (m2), and glacial elevation is divided into 20 elevation bands from 3278 m to the glacial top in 100 m band thicknesses and with the entire glacier being calculated from all the elevation bands.
The degree-day factors, with clear spatial heterogeneity, and including the snow degree-day factor (Ds) and the ice degree-day factor (Di), reflect the speed of melting of snow and ice at unit temperature in a day. Observation snow density data were collected (
where Ds is the snow degree day factor (mm/(℃·d)), calculated from the snow density (${\rho _s},$kg/m3) and the density of water (${\rho _w},$kg/m3).
where Di is the ice degree-day factor (mm/(℃·d)), φ is thelatitude (°), λ is the longitude (°), ω is the aspect (°), and αis the slope (°).
3.3 Accuracy verification
3.3.1 Glacier mass balance
With respect to the default for the measured or simulated data of the GMB in the MRB, historical documents on the Urumqi Glacier No.1 (Glacier No.1) and the Haxilegen Glacier No.51 of the Kuytun River (Glacier No.51) during the contemporaneous period were used. Glacier No.1 is 82 km to the east and Glacier No.51 is 108 km to the west of the MRB. These glaciers are often used as reference standards to test the reliability of the simulated GMB values in the MRB. As one of ten reference glaciers identified by the WGMS (World Glacier Monitoring Organization), Glacier No.1 is the longest and the most systematically monitored glacier in China. Glacier No.51, the second reference glacier fixed-point monitoring site at the Tianshan Glaciological Station of China, is also a typical glacier on the northern slope of the Tianshan Mountains and has been observed 1-2 times a year since 1998 (
3.3.2 Glacier meltwater
Glacier meltwater is closely associated with changes of the GMB and can also be considered as an indicator to test the accuracy of the simulated GMB results in data-deficient regions. We estimated the amount of glacier meltwater and its recharge rate to river runoff each year (
| Year | ELA (m) | GMB (mm.w.e.) | Glacier meltwater (108 m3) | River runoff | Recharge rate of glacier meltwater |
|---|---|---|---|---|---|
| 2000 | 4538 | -545.86 | 3.29 | 16.29 | 0.20 |
| 2001 | 4550 | -566.88 | 2.99 | 14.43 | 0.21 |
| 2002 | 4530 | -551.41 | 3.51 | 18.74 | 0.19 |
| 2003 | 4558 | -584.20 | 3.22 | 11.05 | 0.29 |
| 2004 | 4560 | -620.49 | 3.47 | 12.28 | 0.28 |
| 2005 | 4532 | -575.59 | 3.37 | 13.39 | 0.25 |
| 2006 | 4588 | -632.19 | 3.63 | 13.18 | 0.28 |
| 2007 | 4537 | -602.90 | 3.68 | 15.47 | 0.24 |
| 2008 | 4569 | -624.72 | 3.27 | 13.77 | 0.24 |
| 2009 | 4507 | -464.85 | 2.91 | 11.00 | 0.26 |
| 2010 | 4533 | -527.05 | 3.36 | 16.62 | 0.20 |
| 2011 | 4560 | -602.95 | 3.65 | 11.74 | 0.31 |
| 2012 | 4555 | -597.01 | 3.46 | 12.54 | 0.28 |
| 2013 | 4553 | -587.42 | 3.41 | 13.37 | 0.25 |
| 2014 | 4556 | -563.95 | 3.21 | 10.65 | 0.30 |
| 2015 | 4573 | -605.61 | 4.01 | 18.35 | 0.22 |
| 2016 | 4528 | -558.11 | 3.48 | 15.45 | 0.23 |
| Average | 4549 | -577.13 | 3.41 | 14.02 | 0.25 |
Table 4.
The GMB, glacier meltwater and recharge rates in the MRB during 2000-2016
4 Results
4.1 Characteristics of temperature and precipitation
Glaciers are highly sensitive to climate change, but the complexity of glacial climate and the difficulty of comprehensive monitoring restricts accurate meteorological studies in alpine regions, thus in such circumstances the accuracy of the GMB simulation may be compromised. Hence, the inversion models of temperature and precipitation combined with downscaling methods were constructed to improve dramatically the accuracy of the meteorological data. During the period 2000-2016, the average interannual temperature of the glaciers in the MRB was -7.57℃ (Figures 2a and 2b). From the vertical changes of the GMB, the turnover point of temperature was at an altitude of about 4200 m because the temperature decreased at a relatively large rate of 0.57℃/100 m from the glacial terminal to 4200 m but then at a smaller rate of 0.03℃/100 m from 4200 m to 4700 m; thereafter, there was a sharp change between 4700 and 4800 m with a sudden drop of 1.48℃/100 m and finally a minimum of -8.85℃ was reached at 4800 m. The interannual average precipitation of the glaciers in the MRB was 410.71 mm and this also shifted significantly at 4200 m with a maximum of 418.25 mm; thereafter, precipitation increased at a rate of 4.89 mm/100 m from the glacier terminus to 4200 m but at a decreasing rate of 2.66 mm/100 m from 4200 m to 4700 m, then a minimum of 399.89 mm at 4700 m was reached and finally there was a rapid increase of 5.17 mm/100 m from 4700 m to the top of the glacier (Figures 2a and 2b).
Climate change is the key to variation of the GMB, especially in the melting period (May to September). It was observed that the changes of temperature and precipitation in the melting period (Figures 2c and 2d) were remarkably consistent with their annual periods (Figures 2a and 2b), thus indicating that the annual variations are deeply affected by the changes in the melting period. During the glacial ablating period, an altitude of 4200 m is the dividing line for changes of temperature and precipitation, the temperature lapse rate being -0.65℃/100 m below this point but being -0.17℃/100 m above 4200 m. The minimum temperature appears at an altitude of about 4800 m. The precipitation gradient below 4200 m, from 4200 m to 4800 m and from 4800 m to the top of the glacier is 5.9 mm/100 m, -2.04 mm/100 m and 6.24 mm/100 m, respectively. Moreover, the maximum precipitation zone lies in between 4100 and 4200 m in the MRB. In general, the meteorological inversion models combined with the downscaling methods can improve considerably the objectivity and performance of the MOD11C3 and TRMM 3B43 data in the MRB.
![]()
Figure 2.
4.2 Characteristics of the GMB change
The changes of the GMB, reflected in the sum of the glacier ablation and accumulation, continuously appeared negative in the MRB during the study period (
![]()
Figure 3.
The GMB change also had significant vertical zonality because there were some differences of hydrothermal combination and degree-day factors in the elevation bands (
![]()
Figure 4.
To examine how the GMB varied with increase of altitude, a linear regression model for the ablation area, the accumulation area and the overall glacier was built (
| Region | Fitting equation | Correlation |
|---|---|---|
| Ablation area | y1 = 2.4483x - 10729 | |
| Accumulation area | y2 = 0.1877x - 788.3 | |
| Glacier region (whole) | y3 = 1.7909x - 2522.5 (linear) | |
| y4 = -0.0014x2 +13.75x - 32691 (non-linear) |
Table 5.
Variation of the fitting curves of the GMB with altitude in the glacier zones
4.3 Factors influencing the GMB
Glacier meltwater, produced by the changes of the GMB, has an evident replenishment effect on river runoff in arid areas. The intraannual changes of the GMB to runoff indicate that the strongest glacier melting (-575.63 mm w.e.) accounted for 75.4% of the total annual amount of the GMB in July and August, while the runoff (7.73 × 10⁸ m3) accounted for 55.1% of the total annual amount of runoff and also reached an annual peak (
Most inland rivers in alpine mountains originate from the “three-elements” (glacier meltwater, rainfall and snow) and they are all crucial replenishment sources for river runoff. During the study period, the interannual recharge rates of glacier meltwater varied from 19% to 31% (average value 25%), which shows a rising upward trend of glacier ablation with intensified glacier melting. The interannual synchronicity shows that the overall correlation coefficient between runoff and the GMB was -0.49. The key point is that the GMB greatly altered replenishment to runoff around 2009 given that the correlation coefficient was reduced from -0.58 to -0.45, while the correlation coefficient between the glacier meltwater and the runoff was reduced from 0.40 to 0.38, which implies that the regulation for the GMB to runoff was weakened. Investigations (
5 Discussion
5.1 Effects of the degree-day factors
The degree-day factors which play a decisive role in the GMB change include the snow degree-day factor (Ds) and the ice degree-day factor (Di). It seems that Ds shows a rapid decrease at the extremes but a gradual rise in the middle whereas Di shows a decrease at the beginning and then rises gradually (
![]()
Figure 5.
5.2 Spatial distribution of the GMB and recharge rates of glacier meltwater to runoff
To explore the distribution patterns of GMB in the Tianshan Mountains, the values for the GMB in the MRB for the east and west branches of Glacier No.1 and Glacier No.51 were compared for the same period.
Glacier meltwater plays a decisive role in regulation and replenishment of rivers and there are clear differences on recharge rates of glacier meltwater to runoff in arid basins. During the study period, the annual recharge rates of glacier meltwater to runoff fluctuated between 19% and 31% in the MRB, while recharge rates ranged from 32.8%-38.5% in the Tarim Inner-flow Basin, 12.01%-11.4% in the Turpan-Hami endorheic drainage and 16.9%-13.7% in the Yili River Basin (
6 Conclusions
(1) Based on the multi-source remote sensing data, inversion models of temperature and precipitation in the Tianshan Mountains were established. Using downscaling methods, the vertical characteristics of temperature and precipitation in the MRB were analyzed. It was shown that the lapse rate of temperature was -0.57℃/100 m and -0.03℃/100 m below and above 4200 m, respectively, while the precipitation gradient was 4.89 mm/100 m below 4200 m, 2.66 mm/100 m from 4200 m to 4700 m and 5.17 mm/100 m above 4700 m, respectively; besides the maximum precipitation zone lay at altitudes between 4100 m and 4200 m. Based on the analysis, the inversion of remote sensing meteorological data can faithfully depict the spatial distribution details of temperature and precipitation in an alpine glacier area.
(2) Multi-source remote sensing data were used to drive the degree-day model to simulate the GMB in the MRB. During the study period, the interannual changes of the GMB maintained continuous negative states while the annual GMB varied from -464.85 mm w.e./a to -632.19 mm w.e./a and the cumulative GMB was up to -9811.19 mm w.e., with the ELA varying from 4057 m to 4588 m. Besides, the glacier melting slowed down during 2000-2002 and 2008-2010 but intensified for 2002-2008 and 2010-2016, while the strongest glacier ablation was during 2005-2009. However, the intraannual changes of the GMB showed that the strongest glacier accumulation occurred in April when precipitation had clearly increased, but the strongest glacier ablation occurred in August when the temperature rose dramatically.
(3) During the study period, river runoff responded strongly to change of the GMB. The most serious intraannual GMB loss reached -575.63 mm w.e. in July and August, accounting for 75.4% of the annual change, which made the runoff account for 55.1% of the annual GMB loss. Besides, the interannual glacier meltwater fluctuated between 19% and 31%, which may have been caused by the differences in precipitation and snow meltwater outside of the glaciers in the MRB.
Above all, there was a small constraint deficiency in the defaults for multi-period glacier area data, so that the changes of glacier area in calculating the GMB were somewhat compromised. As some researchers have indicated, ignoring the changes of area of the glacier would lead to a certain deviation in the GMB estimation, especially for the current global climate warming scenario, which may overestimate the loss of the GMB (
References
[1] Y Q Cao, W Zhang, W J Wang et al. Evaluation of TRMM 3B43 data over the Yangtze River Delta of China. Scientific Reports, 8, 5290-5290(2018).
[2] S Cascone, J Coma, A Gagliano et al. The evapotranspiration process in green roofs: A review. Building and Environment, 147, 337-355(2019).
[3] N Chen, X Z Feng, P F Xiao et al. Analysis of snow layer parameters in Manasi River Basin. Journal of Nanjing University(Natural Sciences), 51, 936-943(2015).
[4] R S Chen. Some knowledge on and parameters of China’s alpine hydrology. Advances in Water Science, 25, 307-317(2014).
[5] H Ezzine, A Bouziane, D Ouazar et al. Downscaling of open coarse precipitation data through spatial and statistical analysis, integrating NDVI, NDWI, elevation, and distance from sea. Advances in Meteorology, 99, 1-20(2017).
[6] S F Jia, W B Zhu, A F Lu et al. A statistical spatial downscaling algorithm of TRMM precipitation based on NDVI and DEM in the Qaidam Basin of China. Remote Sensing of Environment, 115, 3069-3079(2011).
[7] M Kronenberg, M Barandun, M Hoelzle et al. Mass-balance reconstruction for Glacier No.354, Tien Shan, from 2003 to 2014. Annals of Glaciology, 57, 92-102(2016).
[8] Y C Lan, Y P Shen, S F Wu et al. Changes of the glaciers and the glacier water resources in the typical river basins on the north and south slopes of the Tianshan Mountains since 1960s. Journal of Arid Land Resources and Environment, 21, 1-8(2007).
[9] B F Li, Y N Chen, Z S Chen et al. Trends in runoff versus climate change in typical rivers in the arid region of northwest China. Quaternary International, 282, 87-95(2012).
[10] K M Li, Z Q Li, W Y Gao. Recent retreat of glaciers in the East Tianshan Mountains of Xinjiang and its impact on water resources. Chinese Science Bulletin, 56, 2708-2716(2011).
[11] Y Li, H Tao, B D Su et al. Impacts of 1.5°C and 2°C global warming on winter snow depth in Central Asia. Science of The Total Environment, 651, 2866-2873(2019).
[12] J D Mackay, N E Barrand, D M Hannah et al. Glacio-hydrological melt and runoff modelling: Application of a limits of acceptability framework for model comparison and selection. The Cryosphere, 12, 2175-2210(2018).
[13] M Y Mcpartland, E S Kane, M J Falkowski et al. The response of boreal peatland community composition and NDVI to hydrologic change, warming and elevated carbon dioxide. Global Change Biology, 25, 93-107(2019).
[14] S Michaelides, T Karacostas, J L Sanchez et al. Reviews and perspectives of high impact atmospheric processes in the Mediterranean. Atmospheric Research, 208, 4-44(2017).
[15] J X Mu, Z Q Li, H Zhang et al. Mass balance variation of continental glacier and temperate glacier and their response to climate change in western China: Taking Urumqi Glacier No.1 and Parlung No.94 Glacier as examples. Arid Land Geography, 42, 20-28(2019).
[16] S Muattar, J L Ding, S Abudu et al. Simulation of snowmelt runoff in the catchments on northern slope of the Tianshan Mountains. Arid Zone Research, 33, 636-642(2016).
[17] K Naegeli, M Huss, M Hoelzle. Change detection of bare-ice albedo in the Swiss Alps. The Cryosphere, 13, 397-412(2019).
[18] Y P Shen, H C Su, G Y Wang et al. The responses of glaciers and snow cover to climate change in Xinjiang (I): Hydrological effects. Journal of Glaciology and Geocryology, 35, 513-527(2013).
[19] Y F Shi. Concise Glacier Inventory of China(2009).
[20] M Smid, A C Costa. Climate projections and downscaling techniques: A discussion for impact studies in urban systems. The International Journal of Urban Sciences, 22, 277-307(2018).
[21] C Q Song, B Huang, L H Ke et al. Precipitation variability in High Mountain Asia from multiple datasets and implication for water balance analysis in large lake basins. Global and Planetary Change, 145, 20-29(2016).
[22] C J Sun, W Chen. Streamflow components in inland rivers in the Tianshan Mountains, Northwest China. Arid Land Geography, 40, 37-44(2017).
[23] D B M R Van, C Bus, J Ettema et al. Temperature thresholds for degree-day modelling of Greenland ice sheet melt rates. Geophysical Research Letters, 37, 1-5(2010).
[24] G Y Wang, Y P Shen. The effect of change in glacierized area on the calculation of mass balance in the Glacier No.1 at the Headwaters of Urumqi River. Journal of Glacilogy and Geocryology, 33, 1-7(2011).
[25] P Y Wang, Z Q Li, H L Li et al. Recent evolution in extent, thickness, and velocity of Haxilegen Glacier No.51, Kuytun River Basin, Eastern Tianshan Mountains. Arctic, Antarctic, and Alpine Research, 48, 241-252(2016).
[26] X Wang, T Yang, C Xu et al. Understanding the discharge regime of a glacierized alpine catchment in the Tianshan Mountains using an improved HBV-D hydrological model. Global and Planetary Change, 172, 211-222(2019).
[27] X C Wang, X B Dong, H M Liu et al. Linking land use change, ecosystem services and human well-being: A case study of the Manas River Basin of Xinjiang, China. Ecosystem services, 27, 113-123(2017).
[29] Z H Xu, W G Fan, H J Wei et al. Evaluation and simulation of the impact of land use change on ecosystem services based on a carbon flow model: A case study of the Manas River Basin of Xinjiang, China. Science of The Total Environment, 652, 117-133(2019).
[30] Z N Yang. Glacier water resources in China. Natural Resources, 9, 46-55(1987).
[31] G Zhang, Z Li, W Wang et al. Mass balance change in east and west branches of Glacier No.1 at Urumqi riverhead, China, during last 20 years. Chinese Journal of Ecology, 32, 2412-2417(2013).
[32] G F Zhang. Glacier matter balance and its relation to climate change at the source of Urumqi River, Tianshan, China. Lanzhou: Northwest Normal University(2014).
[33] H Zhang, Z Q Li, P Zhou et al. Mass-balance observations and reconstruction for Haxilegen Glacier No.51, eastern Tien Shan, from 1999 to 2015. Journal of Glaciology, 64, 689-699(2018).
[34] Q Zhang, P J Shi, V P Singh et al. Spatial downscaling of TRMM-based precipitation data using vegetative response in Xinjiang, China. International Journal of Climatology, 37, 3895-3909(2017).
[35] R B Zhang, W S Wei, H M Shang et al. A tree ring-based record of annual mass balance changes for the TS. Tuyuksuyskiy Glacier and its linkages to climate change in the Tianshan Mountains. Quaternary Science Reviews, 205, 10-21(2019).
[36] S Q Zhang, B S Ye, S Y Liu et al. A modified monthly degree-day model for evaluating glacier runoff changes in China. Part I: Model development. Hydrological Processes, 26, 1686-1696(2012).
[37] T Zhang, B L Li, Y C Yuan et al. Spatial downscaling of TRMM precipitation data considering the impacts of macro-geographical factors and local elevation in the Three-River Headwaters Region. Remote Sensing of Environment, 215, 109-127(2018).
[39] J T Zheng. Research on runoff evolution in mountainous area under climate change in Manas River. Shihezi: Shihezi University(2018).
[40] G F Zhu, D H Qin, Y F Liu et al. Accuracy of TRMM precipitation data in the southwest monsoon region of China. Theoretical and Applied Climatology, 129, 1-10(2017).

Set citation alerts for the article
Please enter your email address
© Copyright 2018-2021 | Chinese Laser Press. All Rights Reserved 沪ICP备15018463号-20