• Chinese Optics Letters
  • Vol. 13, Issue 10, 100201 (2015)
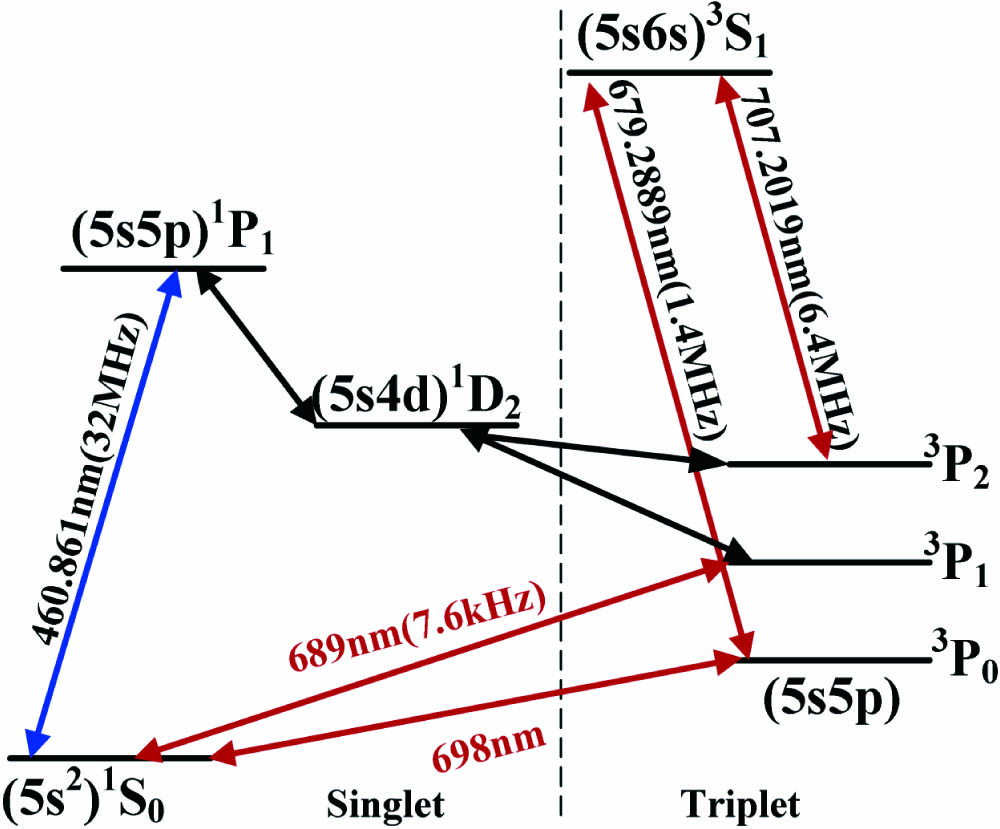
Qinfang Xu1, Hui Liu1、2, Benquan Lu1、2, Yebing Wang1, Mojuan Yin1, Dehuan Kong1, Jie Ren1, Xiao Tian1, and Hong Chang1、*
Author Affiliations
  • 1CAS Key Laboratory of Time and Frequency Primary Standards, National Time Service Center, Xi’an 710600, China
  • 2University of Chinese Academy of Sciences, Beijing 100049, China
  • show less
    DOI: 10.3788/COL201513.100201 Cite this Article Set citation alerts
    Qinfang Xu, Hui Liu, Benquan Lu, Yebing Wang, Mojuan Yin, Dehuan Kong, Jie Ren, Xiao Tian, Hong Chang. Observation of 1S0-3P0 transition of bosonic strontium in the Lamb-Dicke regime[J]. Chinese Optics Letters, 2015, 13(10): 100201 Copy Citation Text show less
    Energy level scheme of the Sr88 atom.
    Fig. 1. Energy level scheme of the Sr88 atom.
    Experimental setup. PMT: photomultiplier tube. EMCCD: electron multiplying charge-coupled device. OFC: optical frequency comb.
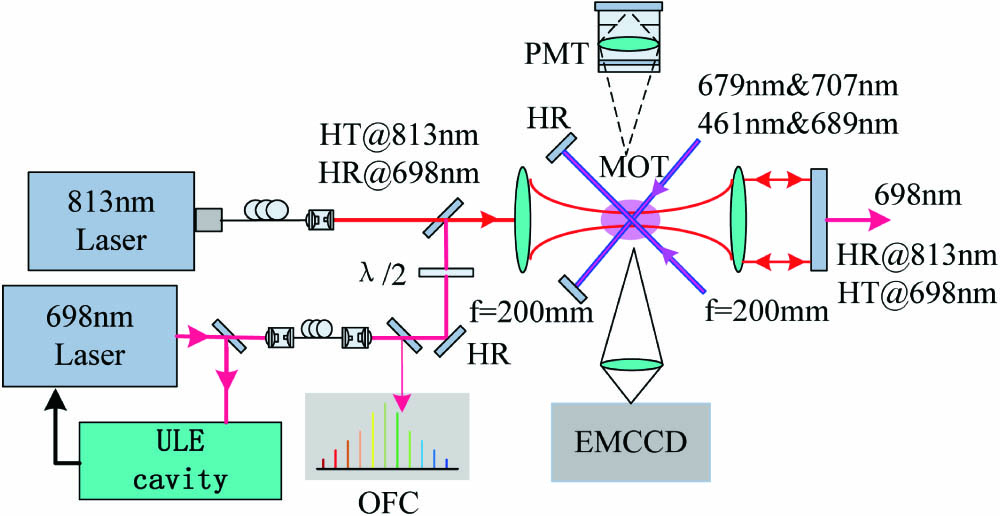
    Fig. 2. Experimental setup. PMT: photomultiplier tube. EMCCD: electron multiplying charge-coupled device. OFC: optical frequency comb.
    Time sequence of the experiment for the 698 nm clock transition.
    Fig. 3. Time sequence of the experiment for the 698 nm clock transition.
    Picture of the optical lattice-loaded atoms.
    Fig. 4. Picture of the optical lattice-loaded atoms.
    Lifetime of the atoms in the 1D optical lattice.
    Fig. 5. Lifetime of the atoms in the 1D optical lattice.
    Clock transition spectrum. The black curve with the resolved sideband is the clock transition’s wide spectrum swept by a 1 kHz step size. The inset shows the narrow spectrum of the transition with a FWHM of 180 Hz; the solid red curve is a Lorentzian fit to the data yields.
    Fig. 6. Clock transition spectrum. The black curve with the resolved sideband is the clock transition’s wide spectrum swept by a 1 kHz step size. The inset shows the narrow spectrum of the transition with a FWHM of 180 Hz; the solid red curve is a Lorentzian fit to the data yields.
    Measurement of the Rabi oscillation. The data are fitted with the function a(1−cos(2πΩFITΔt)exp(Δt/τFIT)) from Ref. [37], where ΩFIT is the actual atomic Rabi frequency and τFIT gives the decoherent time scale.
    Fig. 7. Measurement of the Rabi oscillation. The data are fitted with the function a(1cos(2πΩFITΔt)exp(Δt/τFIT)) from Ref. [37], where ΩFIT is the actual atomic Rabi frequency and τFIT gives the decoherent time scale.
    Qinfang Xu, Hui Liu, Benquan Lu, Yebing Wang, Mojuan Yin, Dehuan Kong, Jie Ren, Xiao Tian, Hong Chang. Observation of 1S0-3P0 transition of bosonic strontium in the Lamb-Dicke regime[J]. Chinese Optics Letters, 2015, 13(10): 100201
    Download Citation