• Chinese Optics Letters
  • Vol. 20, Issue 6, 063401 (2022)
Yuqing Xie1, Yue Jing1, Luyue Niu1, Ci Wang1, Lei Zhao2, Jing Ren1、*, and Jianzhong Zhang1、**
Author Affiliations
  • 1Key Laboratory of In-fiber Integrated Optics, Ministry of Education, Harbin Engineering University, Harbin 150001, China
  • 2State Key Laboratory of Particle Detection and Electronics, University of Science and Technology of China, Hefei 230026, China
  • show less
    DOI: 10.3788/COL202220.063401 Cite this Article Set citation alerts
    Yuqing Xie, Yue Jing, Luyue Niu, Ci Wang, Lei Zhao, Jing Ren, Jianzhong Zhang. Perovskite-quantum-dots activated silica fiber X-ray dosimeter[J]. Chinese Optics Letters, 2022, 20(6): 063401 Copy Citation Text show less
    (a) Schematic diagram of the proposed X-ray detection set-up. (b) Microscopic image of the fiber head covered by PQDs embedded glass powders (left) and scanning electron microscope image of the glass powders (right).
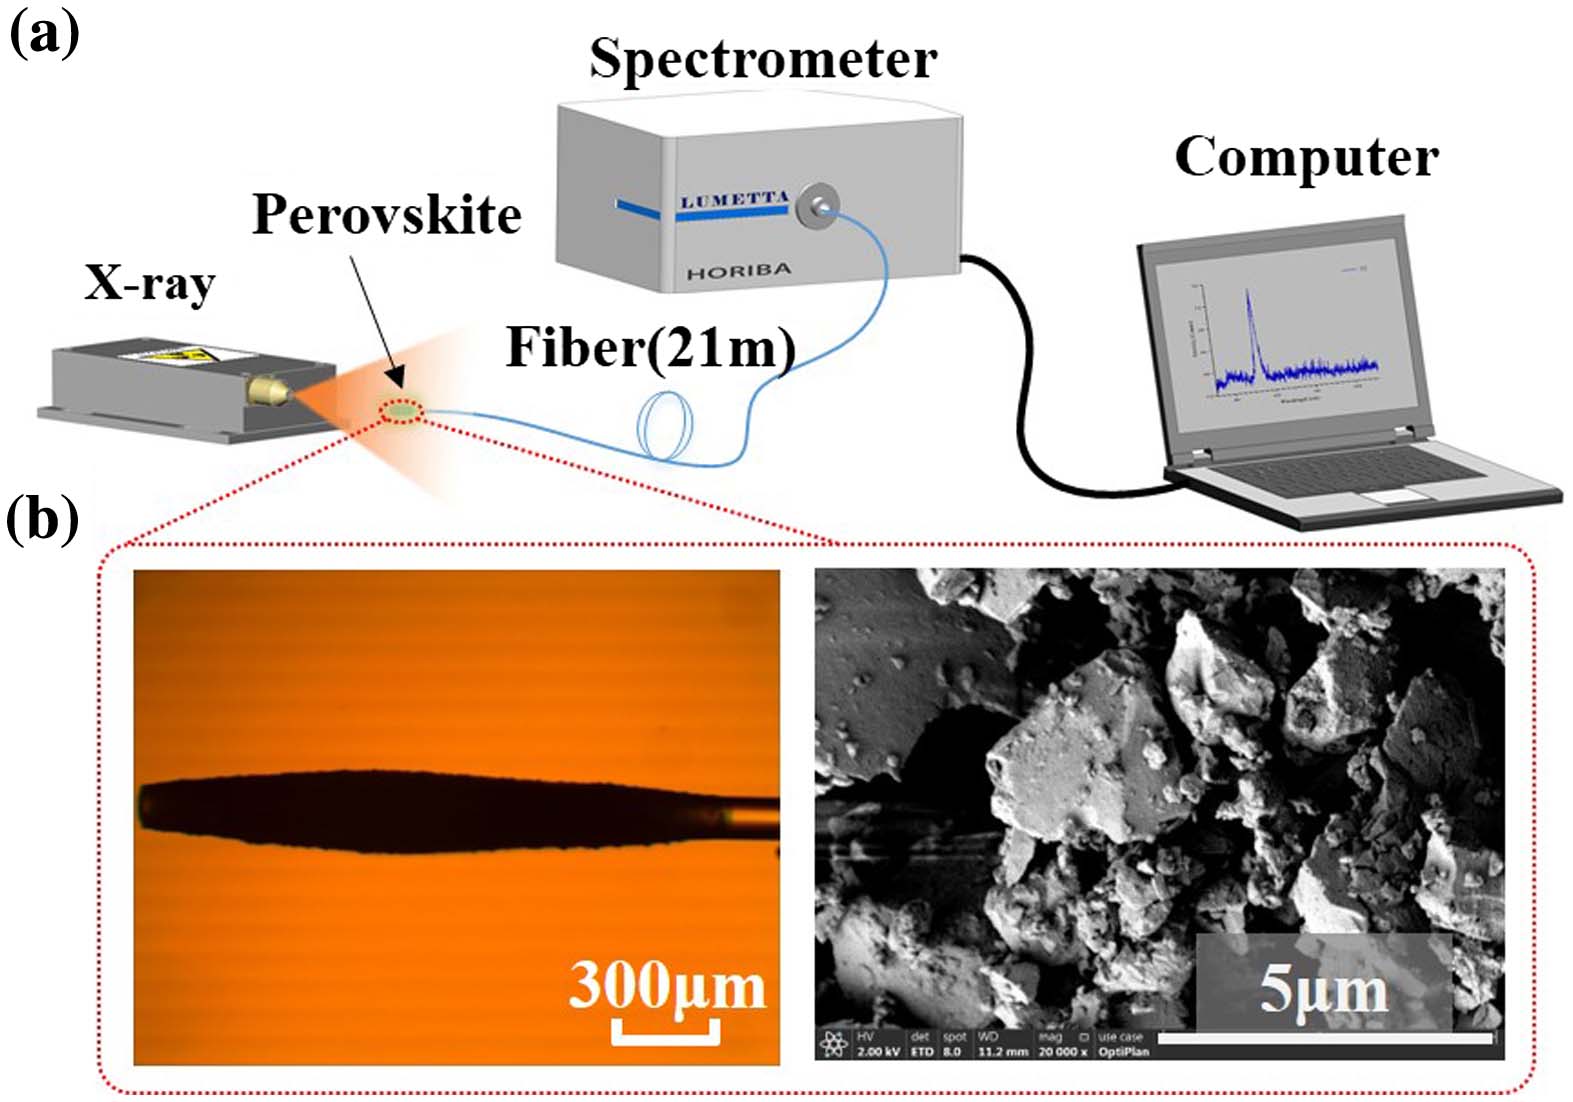
    Fig. 1. (a) Schematic diagram of the proposed X-ray detection set-up. (b) Microscopic image of the fiber head covered by PQDs embedded glass powders (left) and scanning electron microscope image of the glass powders (right).
    (a) PL and PLE spectra of PQDs embedded glass powders. (b) PL decay curve and the fit to the data. (c) Variation of emission spectra and intensity under water boiling treatment repeated six times. Inset: glass powders in a boiling water bath. (d) Variation of emission spectra and intensity under heating (up to 300oC)–cooling (down to room temperature) treatment repeated six times.
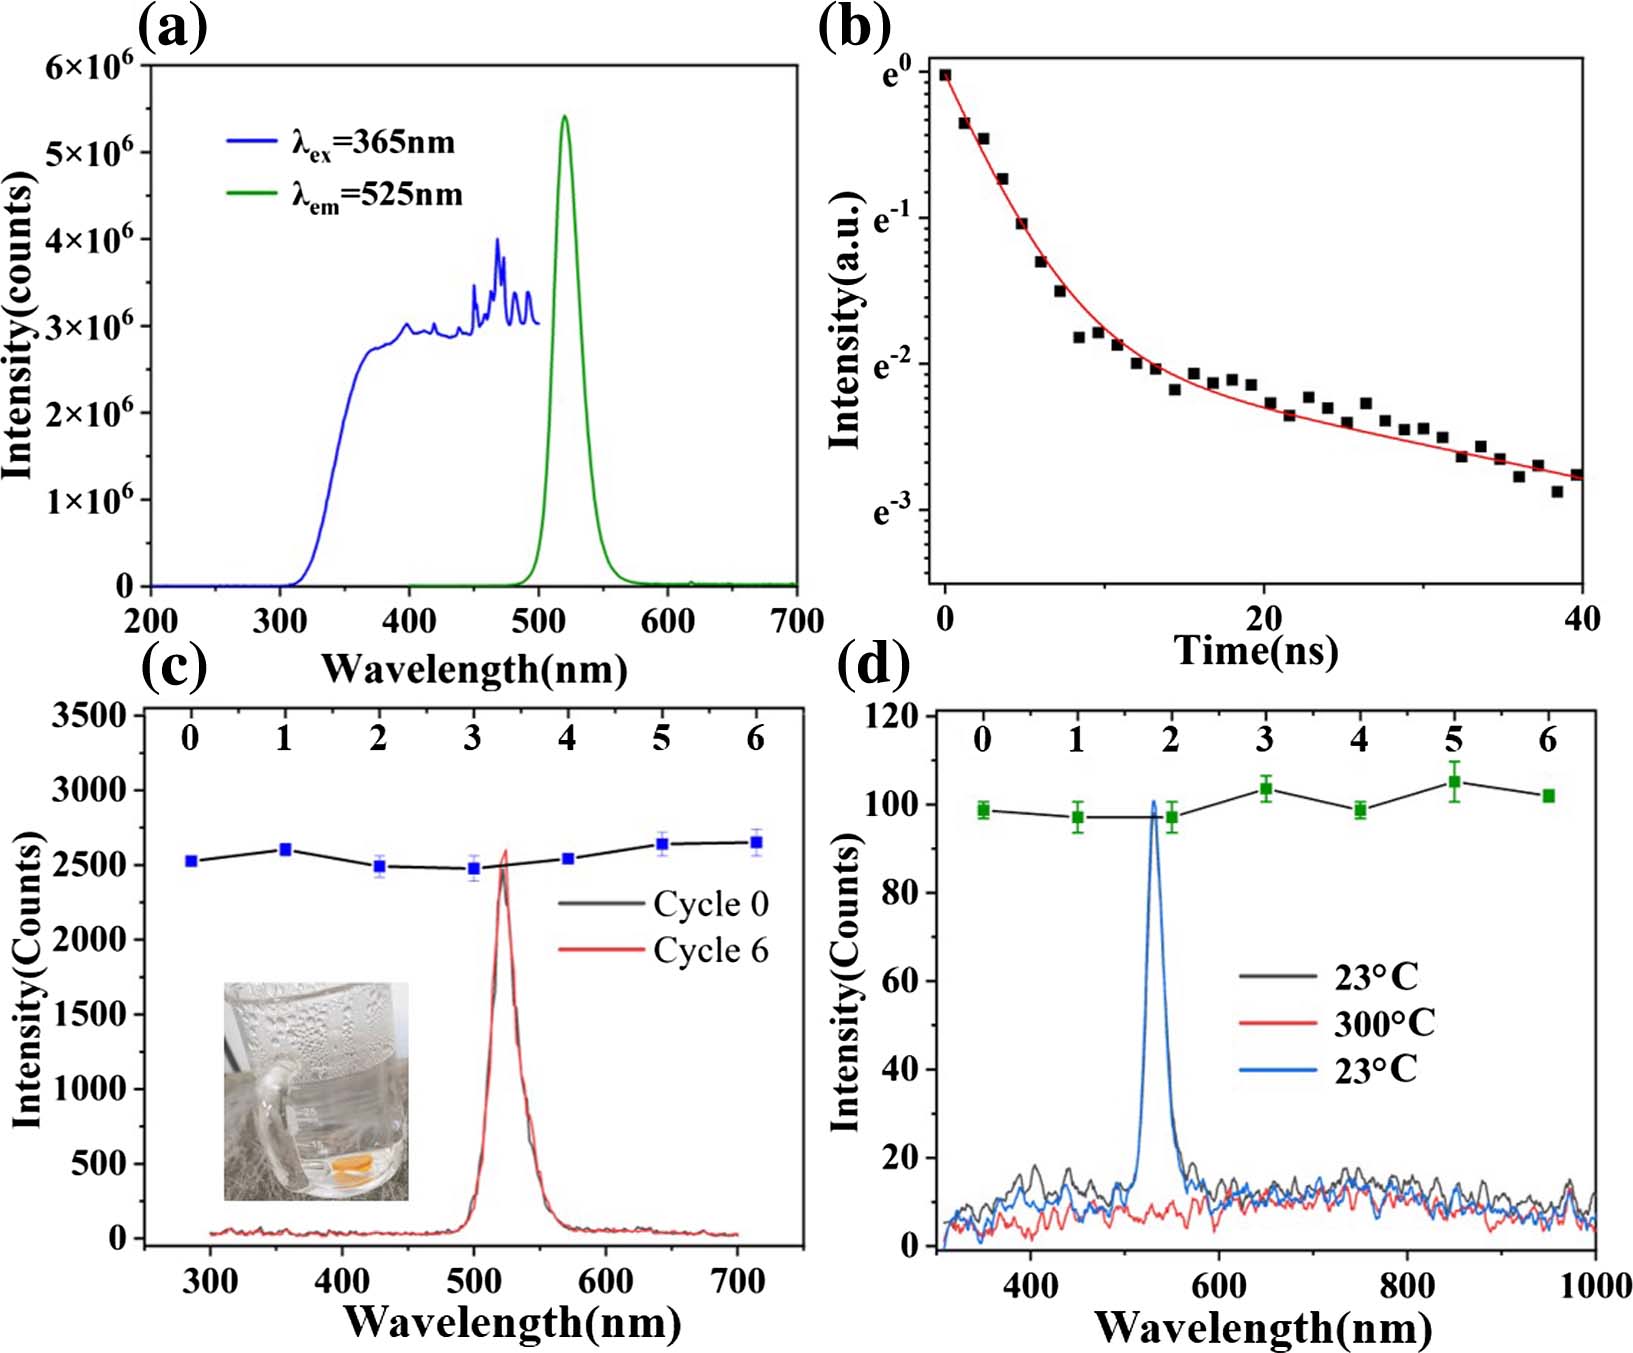
    Fig. 2. (a) PL and PLE spectra of PQDs embedded glass powders. (b) PL decay curve and the fit to the data. (c) Variation of emission spectra and intensity under water boiling treatment repeated six times. Inset: glass powders in a boiling water bath. (d) Variation of emission spectra and intensity under heating (up to 300oC)–cooling (down to room temperature) treatment repeated six times.
    (a) X-ray excited RL spectra of the PQDs activated silica fiber (blue curve) and the un-coated fiber (red curve). Inset: schematic diagram of the fiber sensor. (b) Relationship between the integrated RL intensity and the X-ray dose. Solid line is the linear fit to the data. (c) Variation of the RL intensity as a function of displacement across the X-ray beams. Red line is the Gaussian fit to the data. Inset: an X-ray sensitive glass used to record the X-ray beam spot. The background is the image of an enlarged spot after X-ray irradiation. (d) Changes in the RL spectra and integrated intensity with X-ray exposure time.
    Fig. 3. (a) X-ray excited RL spectra of the PQDs activated silica fiber (blue curve) and the un-coated fiber (red curve). Inset: schematic diagram of the fiber sensor. (b) Relationship between the integrated RL intensity and the X-ray dose. Solid line is the linear fit to the data. (c) Variation of the RL intensity as a function of displacement across the X-ray beams. Red line is the Gaussian fit to the data. Inset: an X-ray sensitive glass used to record the X-ray beam spot. The background is the image of an enlarged spot after X-ray irradiation. (d) Changes in the RL spectra and integrated intensity with X-ray exposure time.
    Yuqing Xie, Yue Jing, Luyue Niu, Ci Wang, Lei Zhao, Jing Ren, Jianzhong Zhang. Perovskite-quantum-dots activated silica fiber X-ray dosimeter[J]. Chinese Optics Letters, 2022, 20(6): 063401
    Download Citation