
Yuanzhi Dong, Yunxia Jin, Fanyu Kong, Jingyin Zhao, Jianwei Mo, Dongbing He, Jing Sun, Jianda Shao. Angle amplifier in a 2D beam scanning system based on peristrophic multiplexed volume Bragg gratings[J]. High Power Laser Science and Engineering, 2023, 11(1): 01000e13
- High Power Laser Science and Engineering
- Vol. 11, Issue 1, 01000e13 (2023)
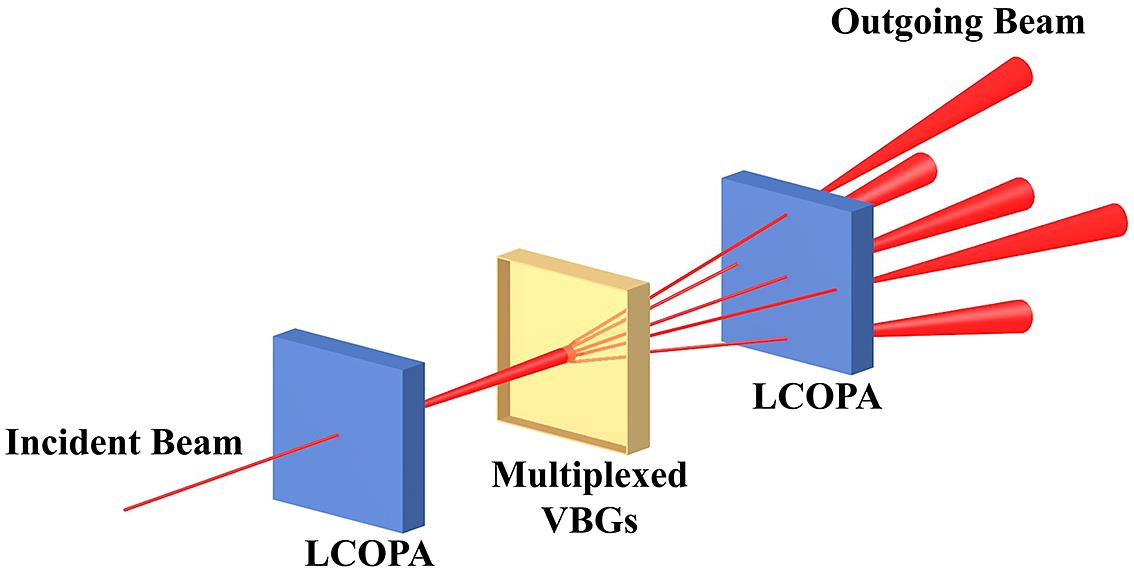
Fig. 1. Scheme of the 2D beam scanning system. The incident beam (outgoing from the first stage addressing LCOPA) into multiplexed VBGs is first deflected to each amplified angle, then the second LCOPA finely controls and fills the beam in each exit angle. The LCOPA is capable of achieving precise angular deflection of the beam within the cone-shaped range.
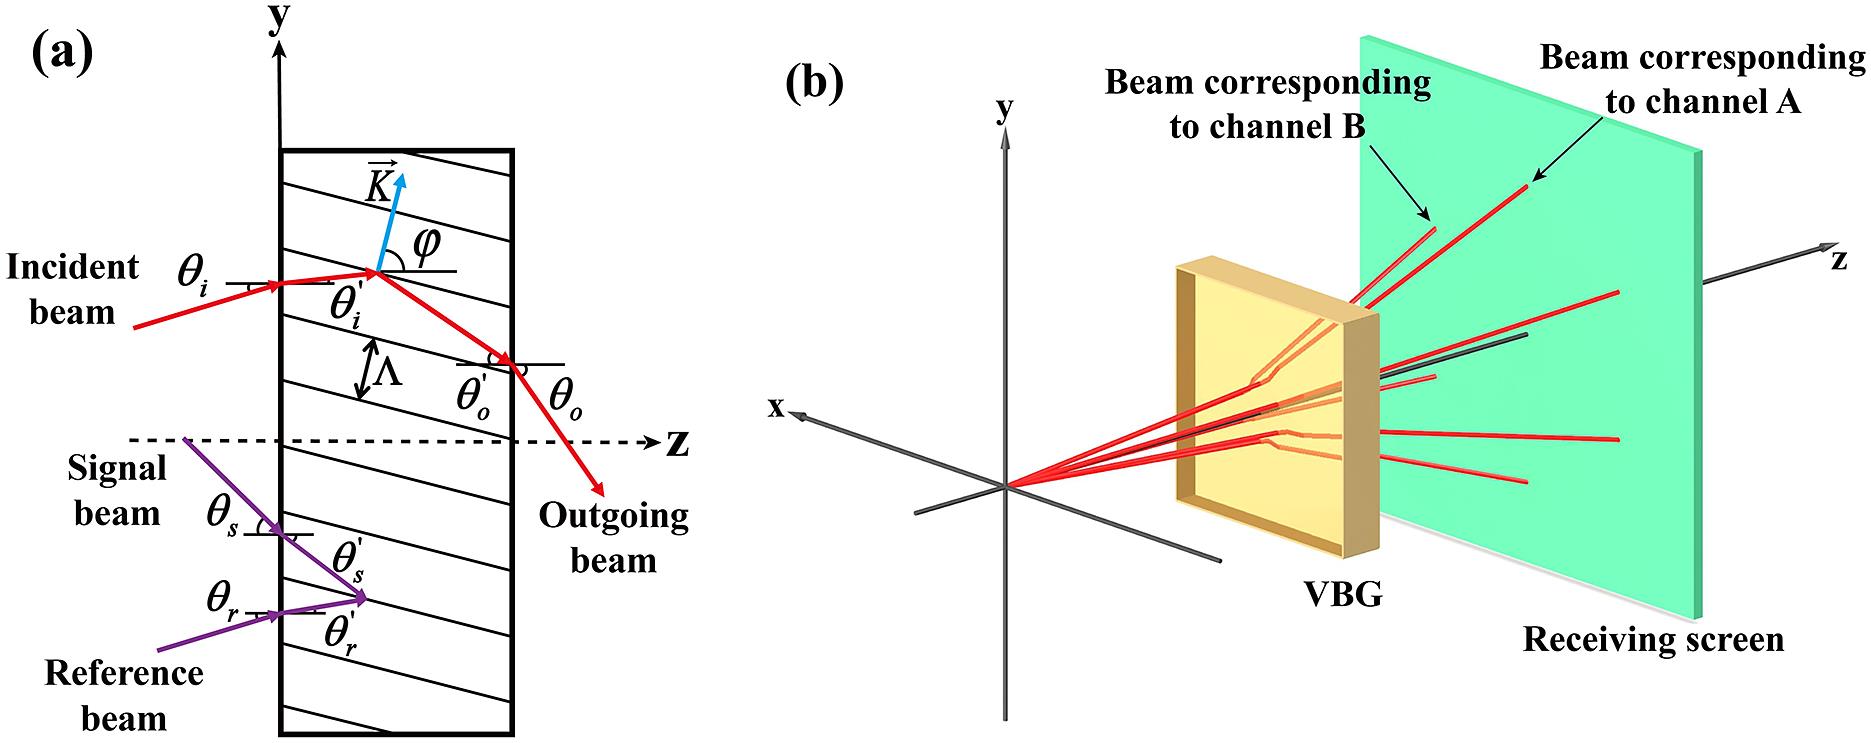
Fig. 2. (a) Typical schematic of volume Bragg grating recording (purple line) as well as diffraction (red line), where the angle is positive when it is turned counterclockwise from the z -axis. (b) Schematic diagram of the beam emerging from the VBG, where the z -axis coincides with the front surface normal of the recording medium, channel-A corresponds to the channel with no rotation angle and channel-B corresponds to the channel with a rotation angle of  .
.
. Fig. 3. Relationship between grating thickness and diffraction efficiency as well as that between refractive index modulation and diffraction efficiency, under  and
and  . The red line corresponds to Equation (11).
and . The red line corresponds to Equation (11). Fig. 4. Schematic diagram of three VBGs working as an amplifier. The beam is deflected to point-M by VBG1 when the incident angle and rotation angle of the incident beam are 1.5° and 0°, respectively, and is deflected to point-N by VBG2 when the incident angle and rotation angle of the incident beam are 3° and 30°, respectively.
Fig. 5. Scheme of DE measurement of multiplexed VBGs. The sample is positioned on a motorized rotational stage and different grating channels are tested using a sample stage, which allows the sample to be rotated around the front surface normal.
Fig. 6. (a) DE and deviation angle of each channel. Experimental angle selectivity curves for the incident angle (b) and exit angle (c) of the first channel in each grating.
Fig. 7. The RIM fitting curve of the first channel of each monolithic VBG and the corresponding picture. The total RIM of a sample would be calculated by summing the RIM of each channel, which is 1.16 × 10⁻³ for VBG1 (a), 1.57 × 10⁻³ for VBG2 (b) and 1.37 × 10⁻³ for VBG3 (c).
|
Table 1. Key parameters of the designed three VBGs.

Set citation alerts for the article
Please enter your email address
© Copyright 2018-2021 | Chinese Laser Press. All Rights Reserved 沪ICP备15018463号-20