• Spectroscopy and Spectral Analysis
  • Vol. 42, Issue 1, 176 (2022)
Lu QIAO, Song-lei WANG*;, Jian-hong GUO, and Xiao-guang HE
Author Affiliations
  • School of Food and Wine, Ningxia University, Yinchuan 750021, China
  • show less
    DOI: 10.3964/j.issn.1000-0593(2022)01-0176-08 Cite this Article
    Lu QIAO, Song-lei WANG, Jian-hong GUO, Xiao-guang HE. Combination of Spectral and Textural Informations of Hyperspectral Imaging for Predictions of Soluble Protein and GSH Contents in Mutton[J]. Spectroscopy and Spectral Analysis, 2022, 42(1): 176 Copy Citation Text show less
    Statistical analysis of soluble protein and GSH contents in different parts
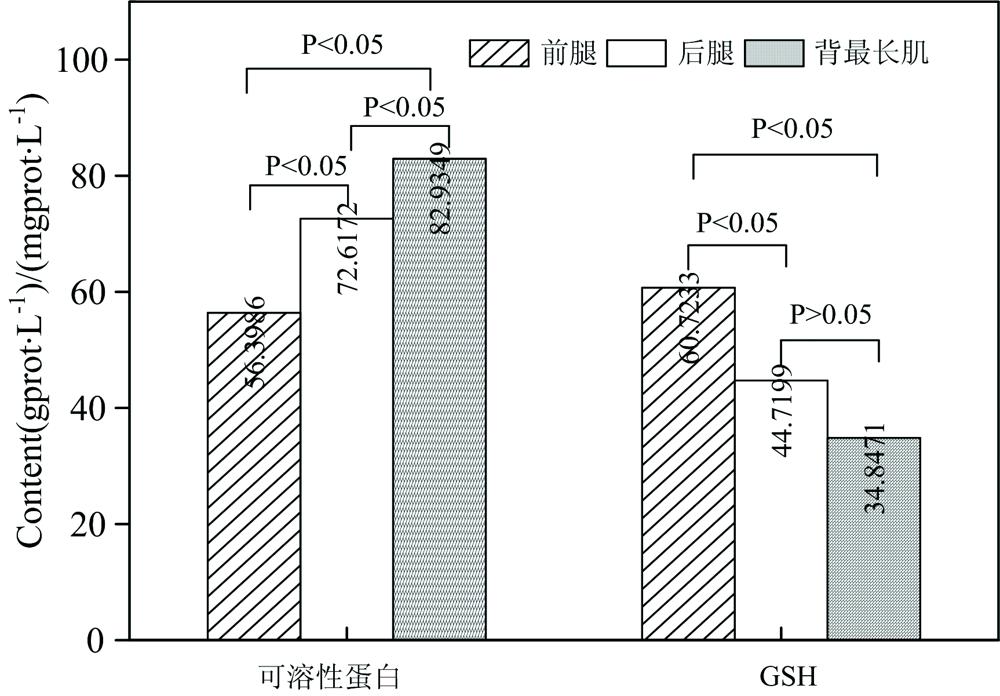
    Fig. 1. Statistical analysis of soluble protein and GSH contents in different parts
    Raw (a) and average spectra (b) of mutton samples
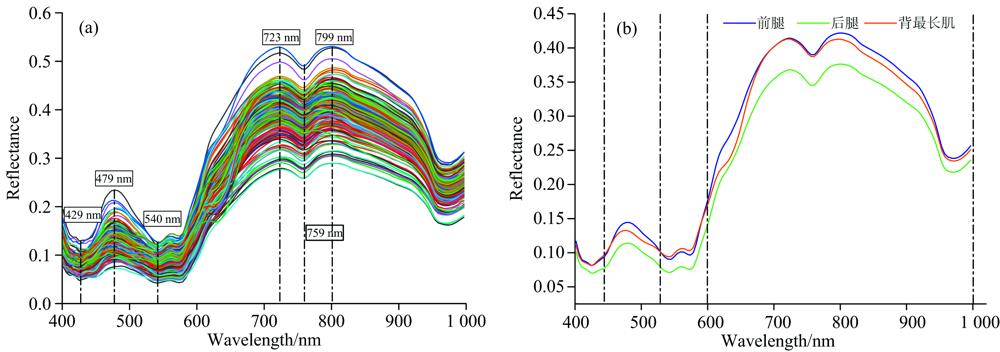
    Fig. 2. Raw (a) and average spectra (b) of mutton samples
    Characteristic wavelengths selected by CARS algorithmA: soluble protein content; B: GSH content
    Fig. 3. Characteristic wavelengths selected by CARS algorithm
    A: soluble protein content; B: GSH content
    Selection of characteristic wavelengths using iVISSA-IRIV algorithm for soluble protein concent
    Fig. 4. Selection of characteristic wavelengths using iVISSA-IRIV algorithm for soluble protein concent
    Selection of characteristic wavelengths using iVISSA-IRIV algorithm for GSH content
    Fig. 5. Selection of characteristic wavelengths using iVISSA-IRIV algorithm for GSH content
    The first three principal component images of mutton samples
    Fig. 6. The first three principal component images of mutton samples
    Comparison of model results(a): Comparison chart for soluble protein content in mutton;(b): Comparison chart for GSH content in mutton
    Fig. 7. Comparison of model results
    (a): Comparison chart for soluble protein content in mutton;(b): Comparison chart for GSH content in mutton
    Visualizations of spatial distributions of soluble protein and GSH contents in mutton
    Fig. 8. Visualizations of spatial distributions of soluble protein and GSH contents in mutton
    样本集校正集预测集
    样本量测量范围平均值标准差样本量测量范围平均值标准差
    可溶性蛋白12819.96~110.8770.5518.294338.81~93.5571.7715.83
    GSH12817.34~172.7546.4324.514317.81~169.9544.0826.38
    Table 1. Statistical of soluble protein and GSH contents of mutton of sample sets
    建模
    对象
    预处理
    方法
    LVs校正集预测集
    RcRMSECRpRMSEP
    可溶性
    蛋白
    Raw170.875 78.830 00.854 79.827 3
    SG160.857 89.398 00.814 910.584 5
    SNV110.828 210.248 10.854 29.726 8
    OSC130.848 69.674 20.846 89.919 2
    Detrend100.830 110.195 90.881 49.074 5
    GSHRaw170.810 014.375 00.780 513.564 0
    SG160.751 716.168 40.732 218.155 8
    SNV170.804 814.049 60.826 512.355 8
    OSC110.862 112.423 10.702 020.074 0
    Detrend140.816 014.170 70.745 816.678 1
    Table 2. PLSR models for mutton indicators by different pretreatment methods
    建模对象模型特征波长数特征波长校正集预测集
    RcRMSECRpRMSEP
    可溶性蛋白MLR125Raw0.872 110.214 20.832 110.987 3
    48CARS0.918 49.210 90.860 410.822 0
    31iVISSA-IRIV0.904 29.020 50.881 69.454 6
    LS-SVM125Raw0.891 88.971 30.867 08.423 8
    48CARS0.929 66.806 10.885 28.640 1
    31iVISSA-IRIV0.914 67.422 50.881 88.527 2
    GSHMLR125Raw0.798 615.864 50.773 420.062 3
    19CARS0.841 014.440 10.795 524.017 4
    29iVISSA-IRIV0.844 614.998 50.870 515.517 7
    LS-SVM125Raw0.777 215.430 60.724 246.348 1
    19CARS0.855 812.689 30.729 727.272 9
    29iVISSA-IRIV0.936 49.102 80.708 230.307 2
    Table 3. Prediction results for soluble protein and GSH content in mutton using different characteristic wavelengths and models
    Lu QIAO, Song-lei WANG, Jian-hong GUO, Xiao-guang HE. Combination of Spectral and Textural Informations of Hyperspectral Imaging for Predictions of Soluble Protein and GSH Contents in Mutton[J]. Spectroscopy and Spectral Analysis, 2022, 42(1): 176
    Download Citation