
Gen WANG, Dong-Yong WANG, Rong WU. Application study of Himawari-8/AHI infrared spectral data on precipitation signal recognition and retrieval [J]. Journal of Infrared and Millimeter Waves, 2020, 39(2): 251
- Journal of Infrared and Millimeter Waves
- Vol. 39, Issue 2, 251 (2020)
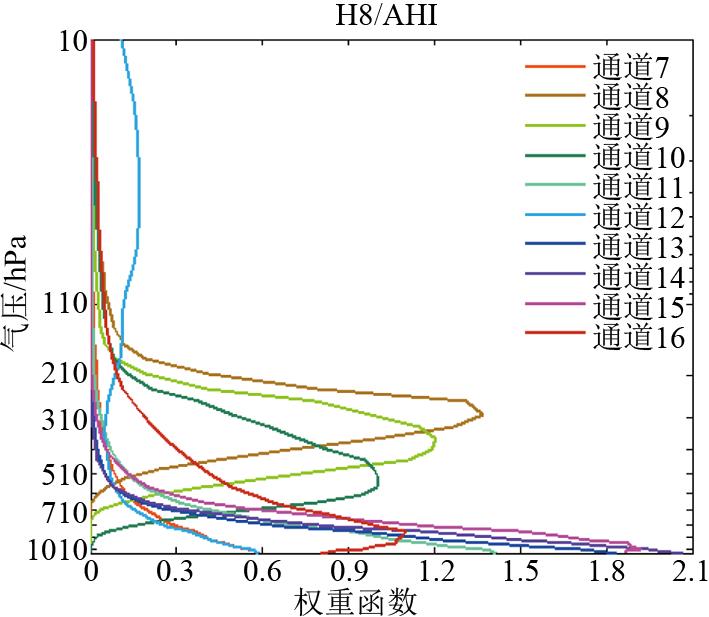
Fig. 1. Weight function of H8/AHI channel 7 to 16 based on RTTOV model
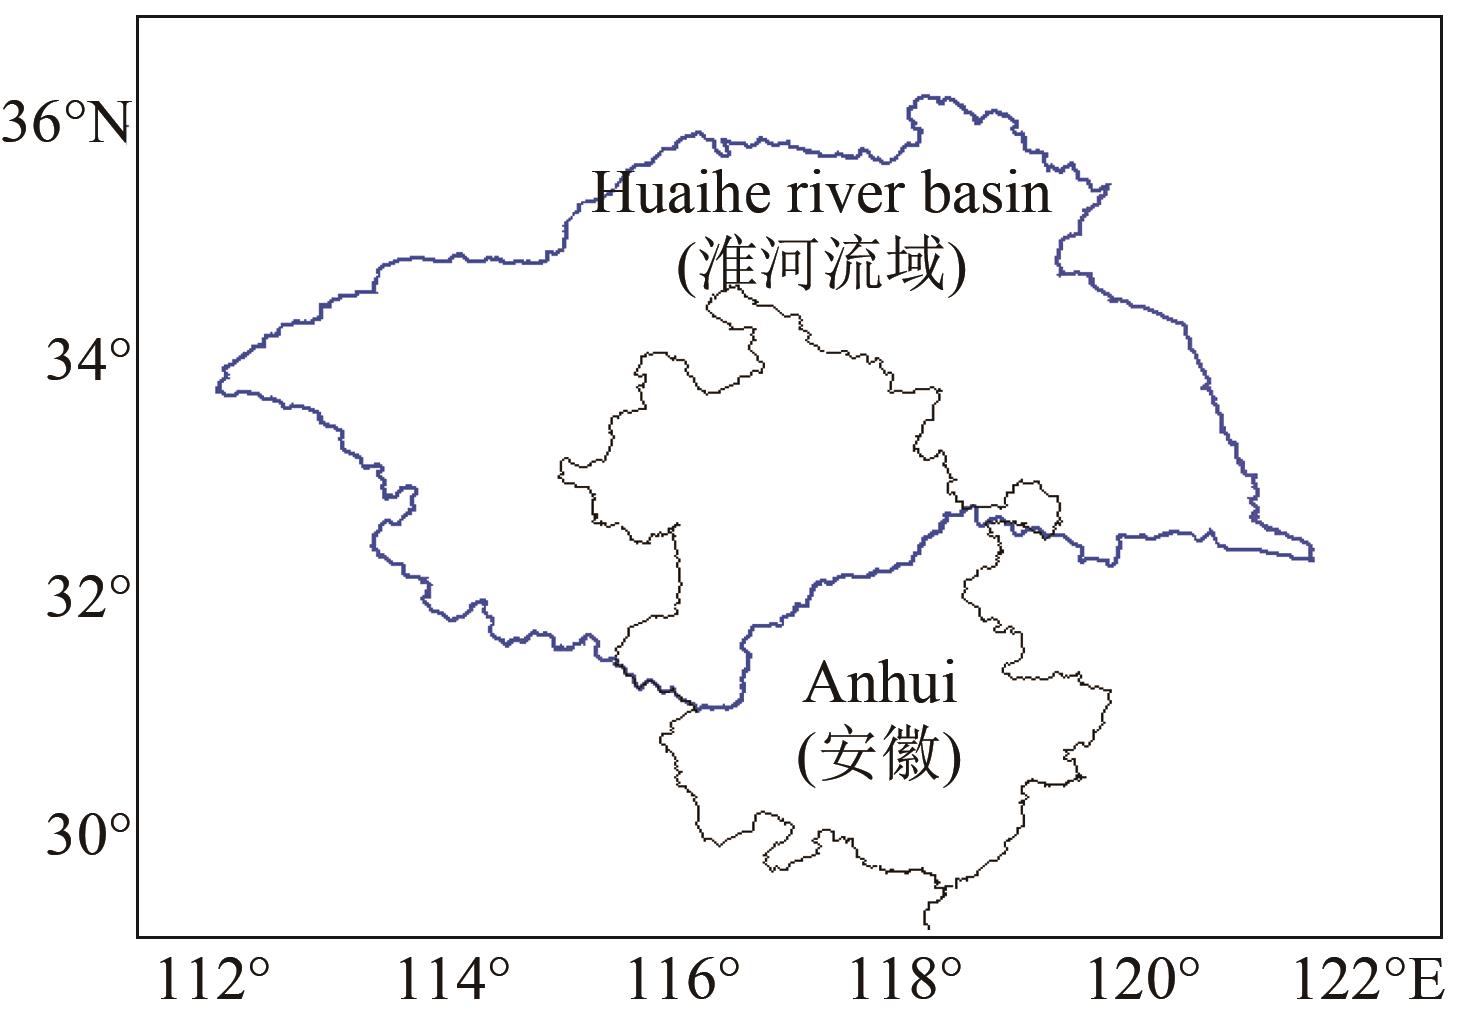
Fig. 2. Area Coverage of Anhui zone and Huaihe river basin
Fig. 3. Comparison of radiance characteristics for precipitation and non-precipitation FOVs, average brightness temperature of H8/AHI(left) and brightness temperature gradient (right)
Fig. 4. Probability density distribution of GPM precipitation (left) and mean changes of infrared spectral brightness temperature of H8/AHI in different precipitation grades(right)
Fig. 5. FOVs brightness temperature gradient of the non-precipitation and precipitation(left) and mean brightness temperature in different precipitation grades (right)
Fig. 6. Scatter distribution of the different channels between brightness temperatures of H8/AHI
Fig. 7. Optimized contribution rate of the brightness temperature of H8/AHI channel to objective function based on the BMA
Fig. 8. Distribution of retrieval precipitation of different BMA methods and GPM precipitation
Fig. 9. Scatter of H8/AHI retrieval precipitation of different historical sample dictionary, the GPM precipitation and PDF of precipitation difference
Fig. 10. Sequence changes of H8/AHI brightness temperature (left), retrieval precipitation (middle) and GPM precipitation (right)
|
Table 1. Himawari-8/AHI channel-specific central wavelengths and primary purpose
|
Table 2. Quantified index score of retrieval precipitation with different channel contribution rates
|
Table 3. Results of quantitative index scoring for precipitation retrieval with different sample sizes

Set citation alerts for the article
Please enter your email address
© Copyright 2018-2021 | Chinese Laser Press. All Rights Reserved 沪ICP备15018463号-20