• Acta Optica Sinica
  • Vol. 39, Issue 10, 1034001 (2019)
Shanchu Yang1、2, Hong Yu1、*, Ronghua Lu1, Zhijie Tan1、2, and Shensheng Han1
Author Affiliations
  • 1Key Laboratory of Quantum Optics, Shanghai Institute of Optics and Fine Mechanics, Chinese Academy of Sciences, Shanghai 201800, China
  • 2University of Chinese Academy of Sciences, Beijing 100049, China
  • show less
    DOI: 10.3788/AOS201939.1034001 Cite this Article Set citation alerts
    Shanchu Yang, Hong Yu, Ronghua Lu, Zhijie Tan, Shensheng Han. Energy Spectrum Broadening Correction in X-Ray Interferometry via Intensity Correlation[J]. Acta Optica Sinica, 2019, 39(10): 1034001 Copy Citation Text show less
    Schematic of pulsar interferometry via intensity correlation
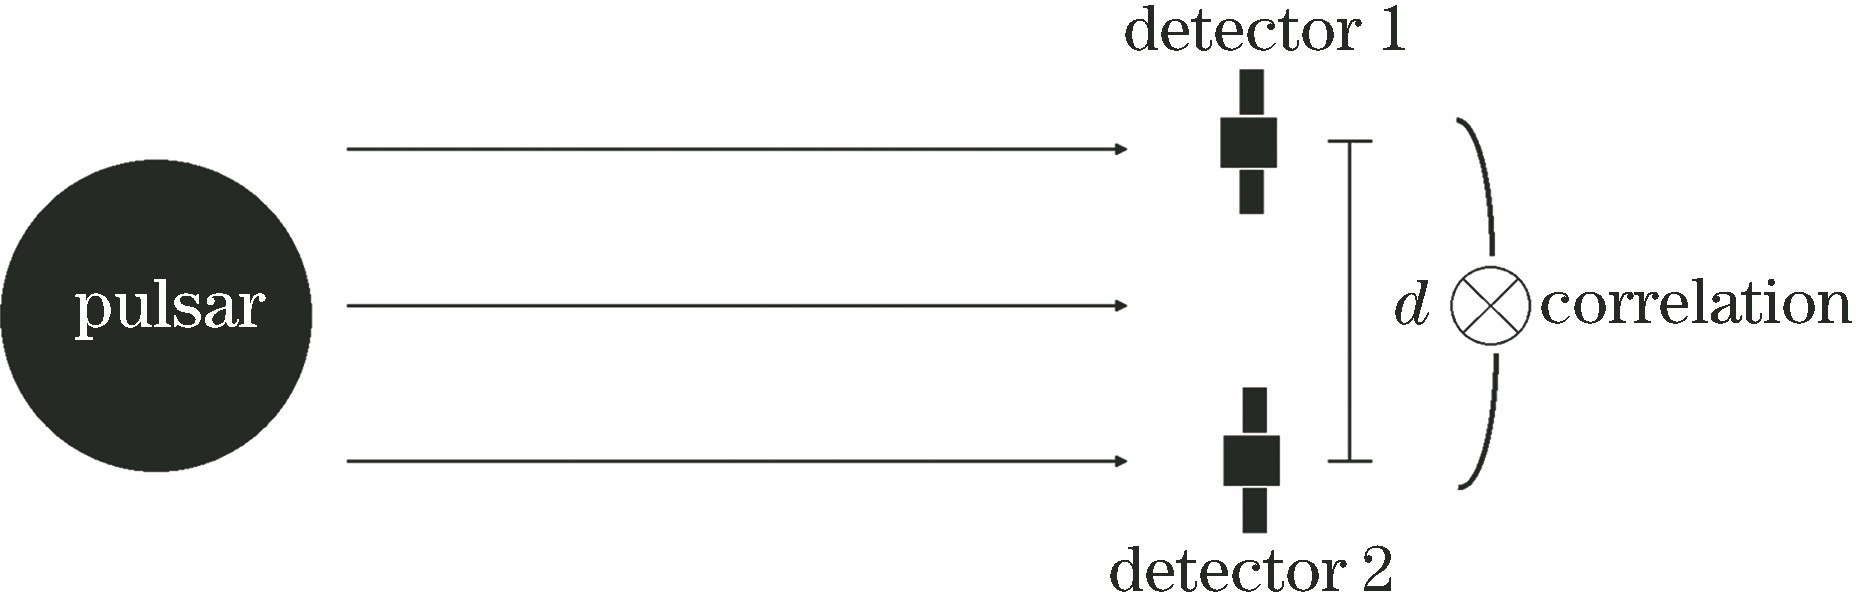
    Fig. 1. Schematic of pulsar interferometry via intensity correlation
    Simulation results of intensity correlated measurement of pulsar X-ray source. (a) Coherence curves obtained by intensity correlation calculation; (b) relationship between the measurement error of coherent distance and the relative spectrum width
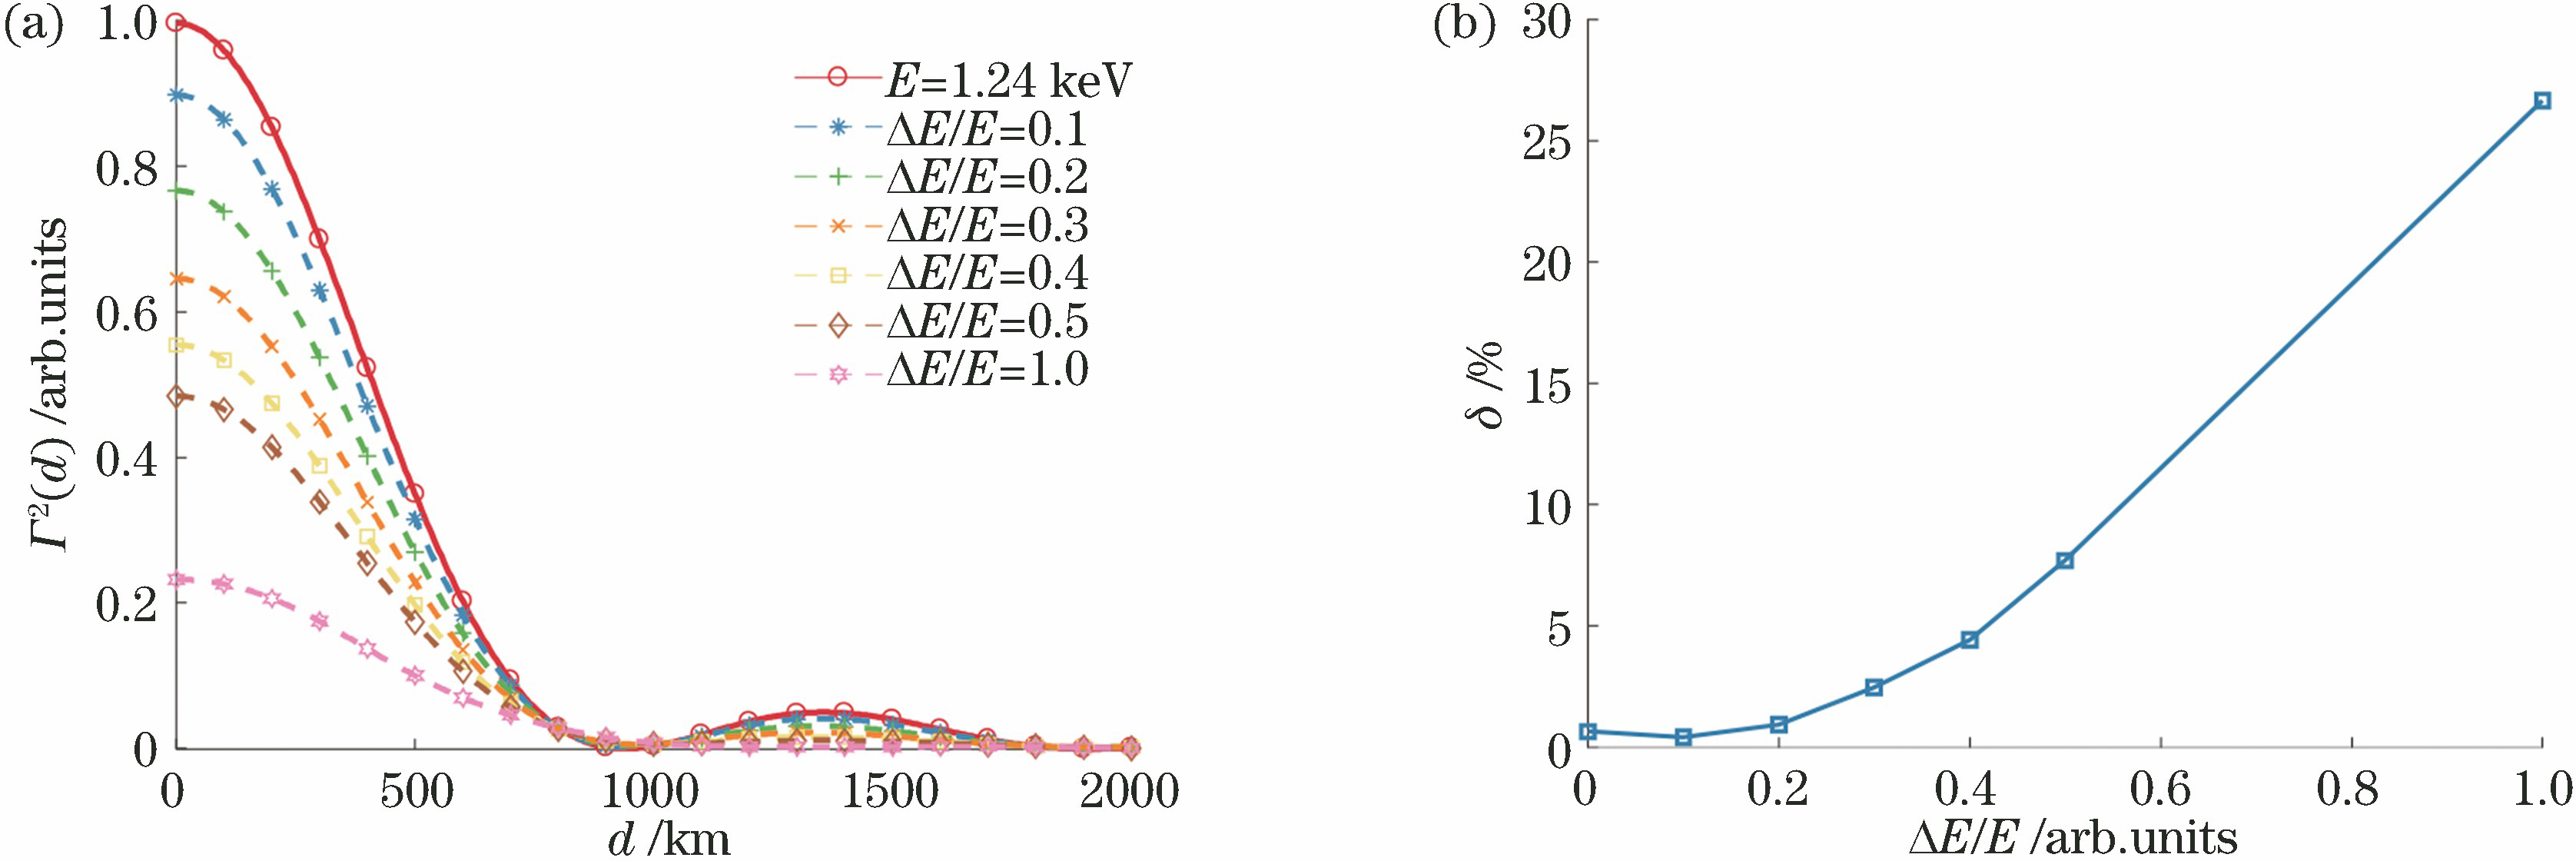
    Fig. 2. Simulation results of intensity correlated measurement of pulsar X-ray source. (a) Coherence curves obtained by intensity correlation calculation; (b) relationship between the measurement error of coherent distance and the relative spectrum width
    Corrected results of intensity correlated measurement. (a) Corrected coherence curves; (b) relationship between the measurement error of coherent distance and the relative spectrum width after correction
    Fig. 3. Corrected results of intensity correlated measurement. (a) Corrected coherence curves; (b) relationship between the measurement error of coherent distance and the relative spectrum width after correction
    Results of corrected coherence curves in noisy environment. (a) Noise ratio is 10%; (b) noise ratio is 100%; (c) noise ratio is 300%; (d) noise ratio is 500%
    Fig. 4. Results of corrected coherence curves in noisy environment. (a) Noise ratio is 10%; (b) noise ratio is 100%; (c) noise ratio is 300%; (d) noise ratio is 500%
    Coherence curves obtained by fitting. (a) Noise ratio is 10%; (b) noise ratio is 100%; (c) noise ratio is 300%; (d) noise ratio is 500%
    Fig. 5. Coherence curves obtained by fitting. (a) Noise ratio is 10%; (b) noise ratio is 100%; (c) noise ratio is 300%; (d) noise ratio is 500%
    Influence of noise ratio on the accuracy of coherence distance correction
    Fig. 6. Influence of noise ratio on the accuracy of coherence distance correction
    Experiment setup of simulated pulsar interferometry via intensity correlation
    Fig. 7. Experiment setup of simulated pulsar interferometry via intensity correlation
    Experiment results of simulated pulsar interferometry via intensity correlation. (a) Spectrum of the simulated source; (b) coherence curves obtained by experiment; (c) coherence curves separated in different wavelengths; (d) relationship between coherence distance and wavelength
    Fig. 8. Experiment results of simulated pulsar interferometry via intensity correlation. (a) Spectrum of the simulated source; (b) coherence curves obtained by experiment; (c) coherence curves separated in different wavelengths; (d) relationship between coherence distance and wavelength
    Shanchu Yang, Hong Yu, Ronghua Lu, Zhijie Tan, Shensheng Han. Energy Spectrum Broadening Correction in X-Ray Interferometry via Intensity Correlation[J]. Acta Optica Sinica, 2019, 39(10): 1034001
    Download Citation