
Feili Wang, Cibo Lou, Yi Liang. Propagation dynamics of ring Airy Gaussian beams with cosine modulated optical vortices[J]. Chinese Optics Letters, 2018, 16(11): 110502
- Chinese Optics Letters
- Vol. 16, Issue 11, 110502 (2018)
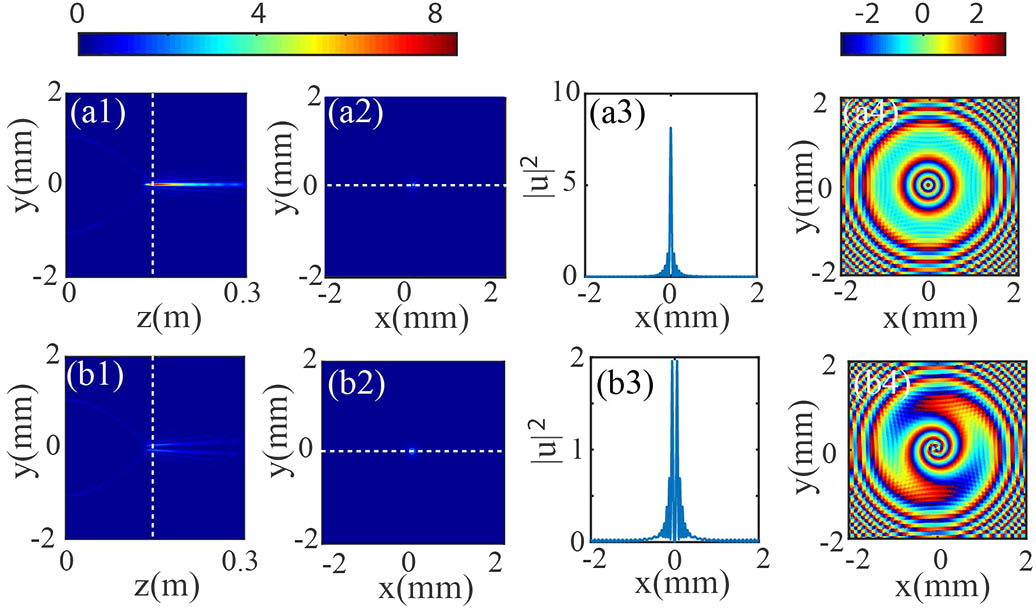
Fig. 1. (a1) The side-view propagation of a common RAG beam; (a2) the intensity profile at the focus plane marked by the dashed line in (a1); (a3) the distribution of | u | 2
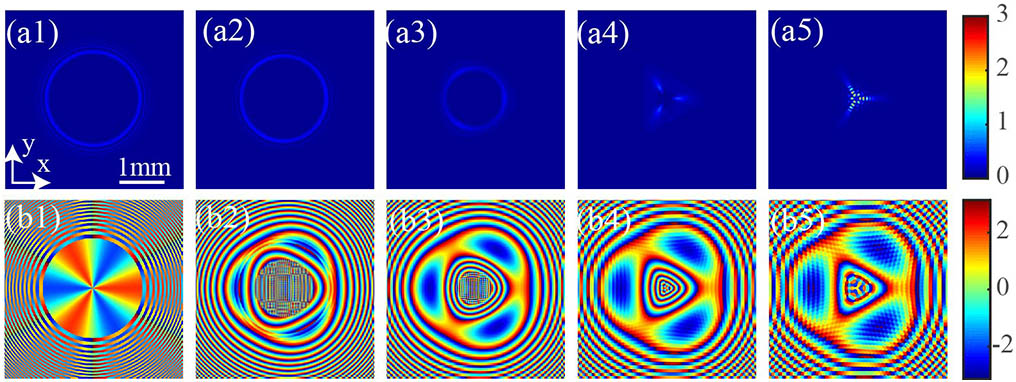
Fig. 2. Intensity and phase patterns of RAGB with CMOV with the parameters C 0 = 1 , m = 0 , n = 3 φ 0 = 0 z = 0 m
Fig. 3. Intensity and phase patterns of RAGB with CMOV for various n z = 0.12 m C 0 = 1 , m = 0 φ 0 = 0 n = 0 , 1 , 2 , 3 , 4
Fig. 4. Intensity and phase patterns of RAGB with CMOV for various φ 0 z = 0.12 m C 0 = 1 , m = 0 n = 3 φ 0 = 0 , π 2 , π , 3 π 2 , 2 π
Fig. 5. (a) The peak intensity distributions of the RAGB with CMOV during propagation for m = 0 n = 0 , 1 , 2 , 3 , 4 n
Fig. 6. Intensity and phase patterns of the RAGB with CMOV with the parameters m = 1 , n = 2 φ 0 = 0 z = 0 m
Fig. 7. The modulation phase distributions and the intensity distributions at z = 0 m z = 0.12 m θ C 0 = 1 , φ 0 = 0 m n m = 0 , n = 3 m = 1 , n = 2
Fig. 8. Intensity and phase patterns of RAGB with CMOV for various φ 0 z = 0.12 m C 0 = 1 , m = 1 n = 2 φ 0 = 0 , π 2 , π , 3 π 2 , 2 π
Fig. 9. Intensity and phase patterns of RAGB with CMOV for various n z = 0.12 m C 0 = 1 , m = 1 φ 0 = 0 n = 0 , 1 , 2 , 3 , 4
Fig. 10. (a) Peak intensity distributions of the RAGB with CMOV during propagation for m = 1 n = 0 , 1 , 2 , 3 , 4 n
Fig. 11. Intensity and phase patterns of RAGB with CMOV for various n z = 0.12 m C 0 = 1 , m = 2 φ 0 = 0 n = 0 , 1 , 2 , 3 , 4
Fig. 12. (a) Peak intensity distributions of the RAGB with CMOV during propagation for m = 2 n = 0 , 1 , 2 , 3 , 4 n

Set citation alerts for the article
Please enter your email address
© Copyright 2018-2021 | Chinese Laser Press. All Rights Reserved 沪ICP备15018463号-20