
T. A. Shelkovenko, I. N. Tilikin, A. V. Oginov, A. R. Mingaleev, V. M. Romanova, S. A. Pikuz. Methods of controlled formation of instabilities during the electrical explosion of thin foils[J]. Matter and Radiation at Extremes, 2023, 8(5): 055601
- Matter and Radiation at Extremes
- Vol. 8, Issue 5, 055601 (2023)
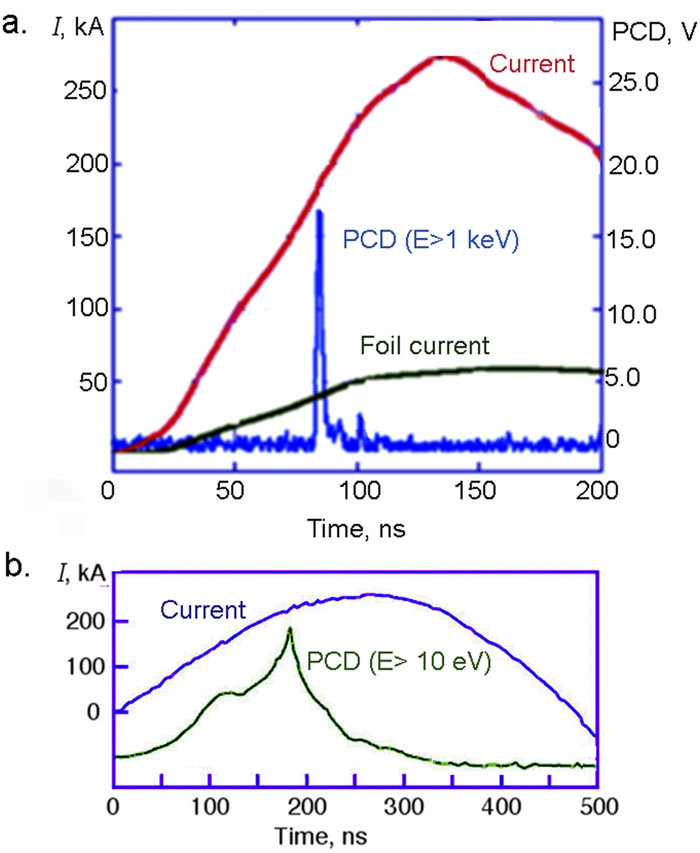
Fig. 1. (a) Signals of the total discharge current, the current through the foil, and the x-ray pulse in the experiment on the BIN generator. (b) Signals of the total discharge current (the current through the foil) and UV radiation (E > 10 eV) from the exploded foil in experiments on the KING generator.
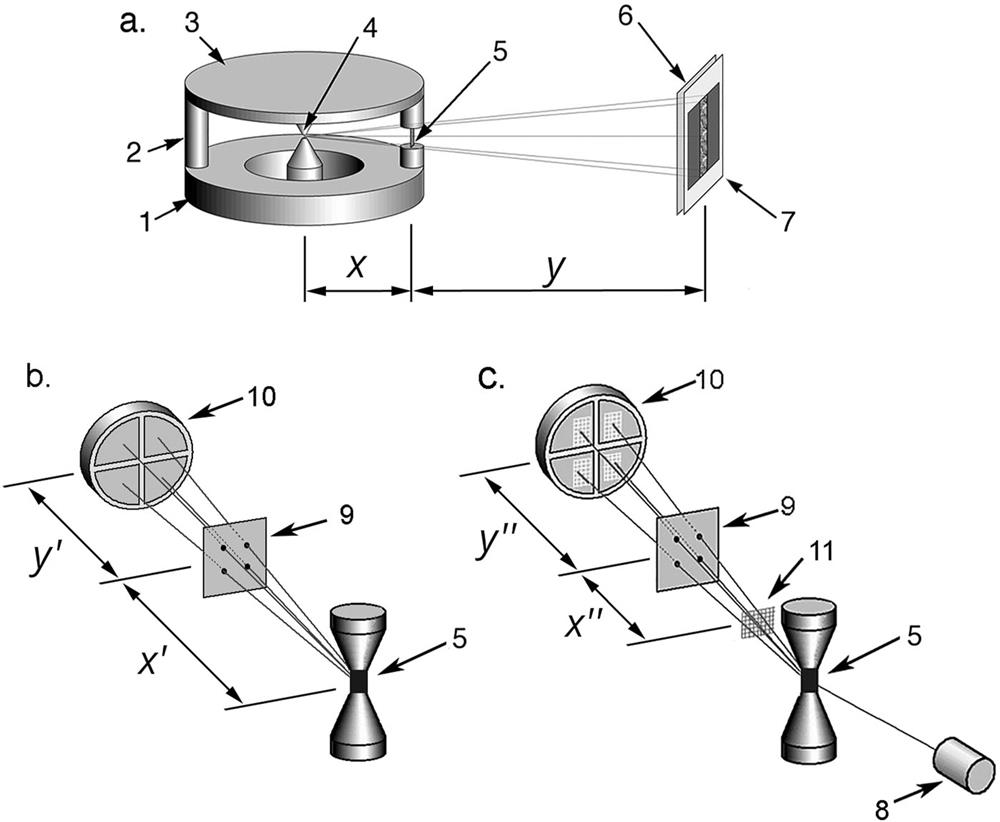
Fig. 2. (a) Schematic of experiments to study the structure of an exploded foil on the BIN generator. (b) Schematic of experiments to study UV radiation from an exploded foil on the KING generator. (c) Schematic of experiments to image a test object in UV radiation from an exploded foil on the KING generator. Key: (1) cathode plate; (2) return current post; (3) anode plate; (4) hybrid X-pinch; (5) thin foil; (6) filter; (7) imaging plate; (8) PCD; (9) pinhole camera; (10) MCP; (11) test object (a mesh with a wire diameter of 200 μ m). y and x are the distances determining the magnifications in each scheme: x = 45 cm, y = 305 cm; y ′ = 57 cm, x ′ = 68 cm; y ″ = 57 cm, x ″ = 35 mm.
Fig. 3. Photographs of the structure of Al foil after laser exposure, as a result of which depressions of diameter 50 μ m and depth 2 μ m are formed, applied with a scale of about 100 μ m.
Fig. 4. (a) Radiograph of an exploded Al foil with sections 1–5 on which various modifications had been made: (1) a section with grooves of width 50 μ m, made with a 100 μ m scale (the distance between the centers of the grooves) parallel to the foil’s initial structure in the X direction; (2) and (4) sections of exploded foil without modification; (3) a section with grooves of width 50 μ m, made through 100 μ m perpendicular to the foil’s initial structure in the Y direction; (5) a section with modification by pits of diameter 50 μ m and scales along the Y and X axes of 50 μ m. The foil’s initial structure is located in the X direction, i.e., parallel to the current. (b) Transmission curve for all sections of the exploded foil.
Fig. 5. Radiograph of an exploded Al foil with sections 1–3 on which modifications had been made in the form of pits of diameter 50 μ m with various scales (average distance between pits) along the Y and X axes: (1) 50 μ m (Y ), 100 μ m (X ); (2) 100 μ m (Y ), 50 μ m (X ); (3) 100 μ m (Y ), 100 μ m (X ); (4) foil without modification. (b) Transmission curve for sections 1–4.
Fig. 6. (a) Photograph of pits taken with ×15 magnification using an optical microscope. (b) Radiograph of an exploded Al foil with sections 1, 3, and 5 on which a modification had been made in the form of pits of diameter 50 μ m with various scales (average distance between pits) along the Y and X axes: (1) 50 μ m (Y ), 100 μ m (X ); (3) 100 μ m (Y ), 50 μ m (X ); (5) 100 μ m (Y ), 100 μ m (X ). Sections 2 and 4 are without modification. The scale of instabilities is 90 μ m in section 1, 45 µ m in section 3, and 90 µ m in section 5. (c) Transmission curve for sections 1–5.
Fig. 7. (a) Pinhole images of exploded 4 μ m thick Al foil without modification obtained in the UV range with radiation energy above 40 eV with a time resolution of 5 ns. The instants at the beginning of each frame are indicated at the top. (b) Intensity curves at the locations marked by lines 1–3 in (a).
Fig. 8. (a) Pinhole images of exploded Al foil with surface modification by pits of diameter 50 μ m and scale (distance between pit centers) of 100 μ m along both the X and Y axes. The images were recorded in the UV range with a time resolution of 5 ns. The instants of the beginning of each frame are indicated at the top. The direction of the current through the foil is shown by the arrow. (b) Intensity curves at the locations marked by lines 1–3 in (a).
Fig. 9. Pinhole images of a mesh with a wire diameter of 200 μ m, obtained in the UV radiation from an exploded Al foil: (a) foil without modification (b) foil with modification of the entire surface by the application of pits of diameter 50 μ m and scale (distance between pit centers) of 100 μ m along both the X and Y axes. The mesh image was obtained with 1.6× magnification. The direction of the current through the foil is shown by the arrows. The moments of the beginning of the frame are indicated at the top.

Set citation alerts for the article
Please enter your email address
© Copyright 2018-2021 | Chinese Laser Press. All Rights Reserved 沪ICP备15018463号-20