• Spectroscopy and Spectral Analysis
  • Vol. 41, Issue 2, 546 (2021)
Shuai YAN1、1, Yong-yu LI1、1, Yan-kun PENG1、1, Ya-chao LIU1、1, and Dong-hai HAN1、1
Author Affiliations
  • 1[in Chinese]
  • 11. College of Engineering, China Agricultural University, National Research and Development Center for Agro-Processing Equipment, Beijing 100083, China
  • show less
    DOI: 10.3964/j.issn.1000-0593(2021)02-0546-06 Cite this Article
    Shuai YAN, Yong-yu LI, Yan-kun PENG, Ya-chao LIU, Dong-hai HAN. A Method for Correcting Nitrofurantoin Raman Signal in Honey Based on Internal Standard of Substrate[J]. Spectroscopy and Spectral Analysis, 2021, 41(2): 546 Copy Citation Text show less
    Raman spectrum of nitrofurantoin standard products (a) and honey SERS spectrum (b) containing nitrofurantoin
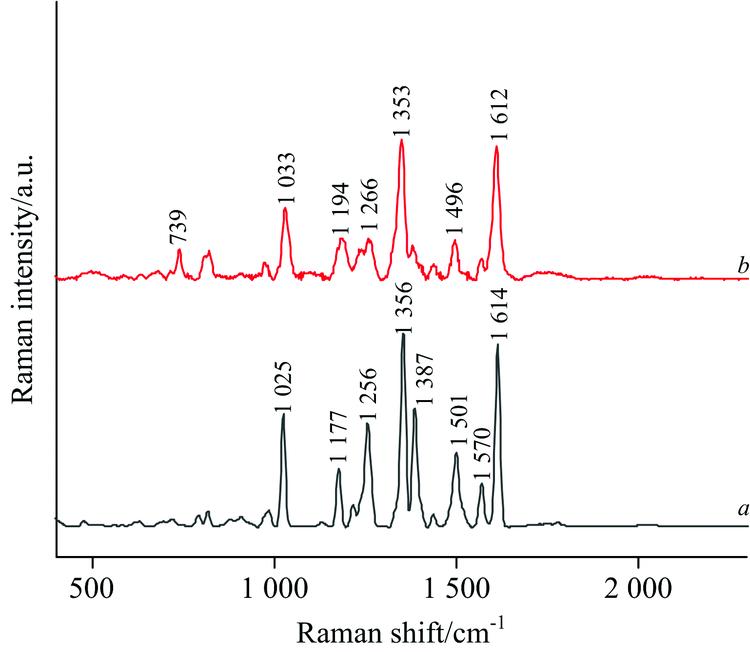
    Fig. 1. Raman spectrum of nitrofurantoin standard products (a) and honey SERS spectrum (b) containing nitrofurantoin
    Surface enhanced Raman spectra of honey containing nitrofurantoin after baseline deduction
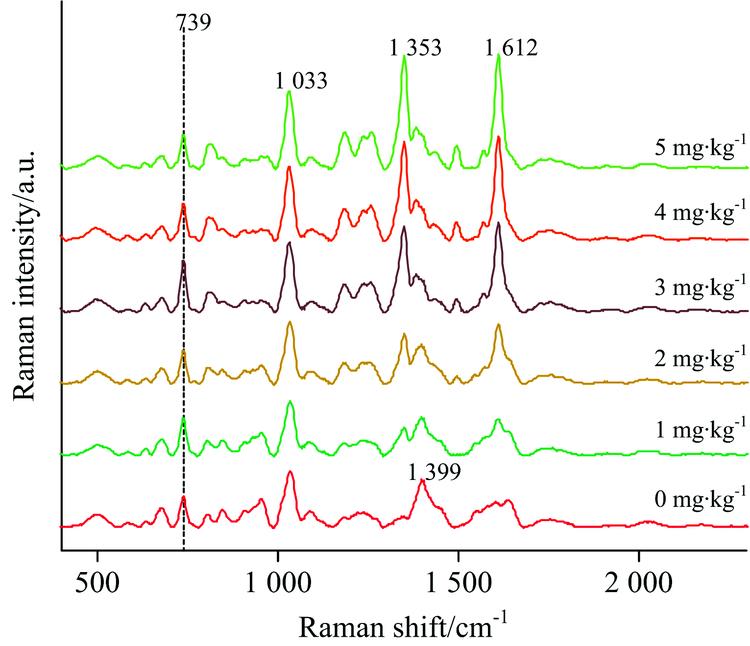
    Fig. 2. Surface enhanced Raman spectra of honey containing nitrofurantoin after baseline deduction
    Raw spectra (a) of 20 mg·kg-1 nitrofurantoin honey and spectra (b) calibrated with Raman characteristic peaks at 739 cm-1
    Fig. 3. Raw spectra (a) of 20 mg·kg-1 nitrofurantoin honey and spectra (b) calibrated with Raman characteristic peaks at 739 cm-1
    Linear relationship between nitrofurantoin concentration and Raman strength at 1 353 cm-1 (a) and 1 612 cm-1 (b) before and after internal standard calibration
    Fig. 4. Linear relationship between nitrofurantoin concentration and Raman strength at 1 353 cm-1 (a) and 1 612 cm-1 (b) before and after internal standard calibration
    Surface enhanced Raman spectra of nitrofurantoin honey(a): Before correction; (b): After correction
    Fig. 5. Surface enhanced Raman spectra of nitrofurantoin honey
    (a): Before correction; (b): After correction
    Comparison of validation set models before and after correction of 1 612 cm-1(a): Calibration set; (b): Verification set
    Fig. 6. Comparison of validation set models before and after correction of 1 612 cm-1
    (a): Calibration set; (b): Verification set
    Modeling methodsRaman shiftCalibration setPrediction setRPD
    RC2RMSECRV2RMSEP
    Linear regression
    analysis method
    I1 3510.861 32.595 90.877 82.194 92.592 3
    I1 351/7390.974 51.046 80.968 11.293 64.172 2
    I1 6120.866 72.536 70.876 22.195 62.622 5
    I1 612/7390.971 21.115 10.969 61.242 24.306 0
    Multiple Linear regression
    analysis method
    I1 351 & I1 6120.870 62.233 30.865 82.034 12.643 7
    I1 351/739 & I1 612/7390.974 81.013 90.966 11.307 74.296 1
    Table 1. Quantitative prediction model of nitrofurantoin in honey
    Shuai YAN, Yong-yu LI, Yan-kun PENG, Ya-chao LIU, Dong-hai HAN. A Method for Correcting Nitrofurantoin Raman Signal in Honey Based on Internal Standard of Substrate[J]. Spectroscopy and Spectral Analysis, 2021, 41(2): 546
    Download Citation