Author Affiliations
1 College of Resources & Environmental Science, Xinjiang University, Urumqi, Xinjiang 830046, China;2 Oasis Ecology Key Laboratory of Ministry of Education, Xinjiang University, Urumqi, Xinjiang 830046, China3 Key Laboratory of Smart City and Environment Modelling of Higher Education Institute, Xinjiang University, Urumqi, Xinjiang 830046, Chinashow less
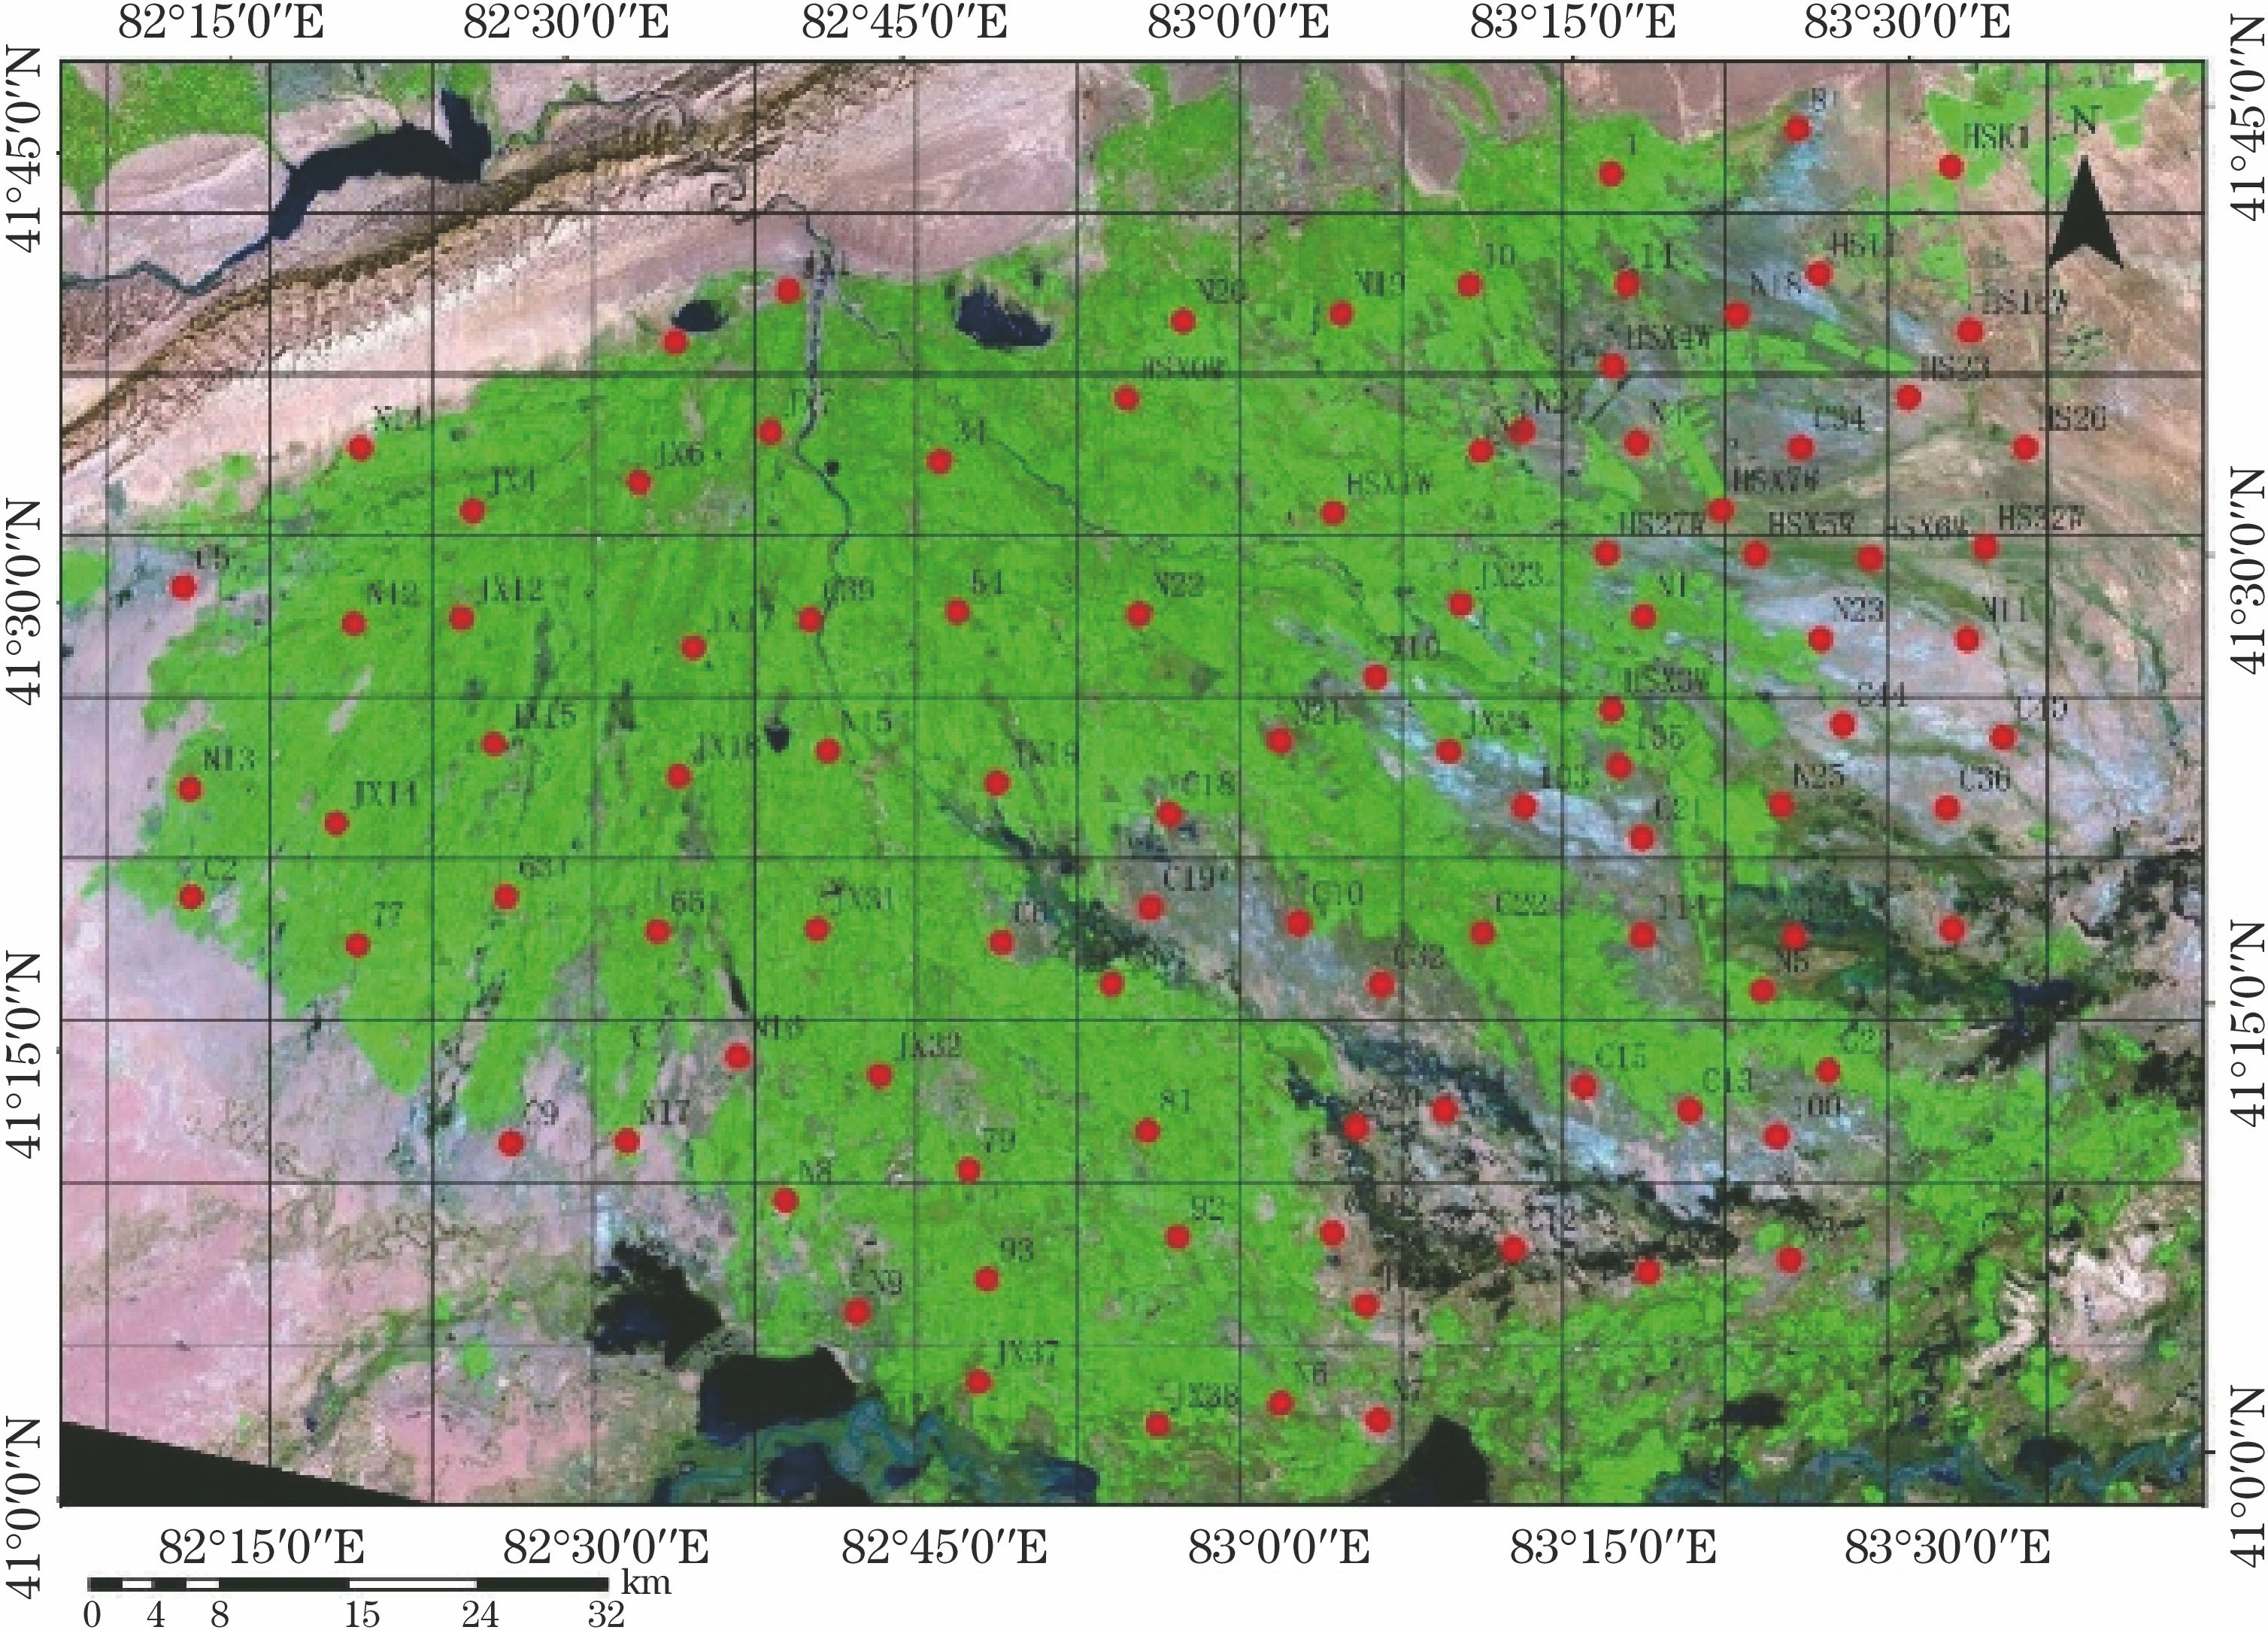
Fig. 1. Research area sampling chart
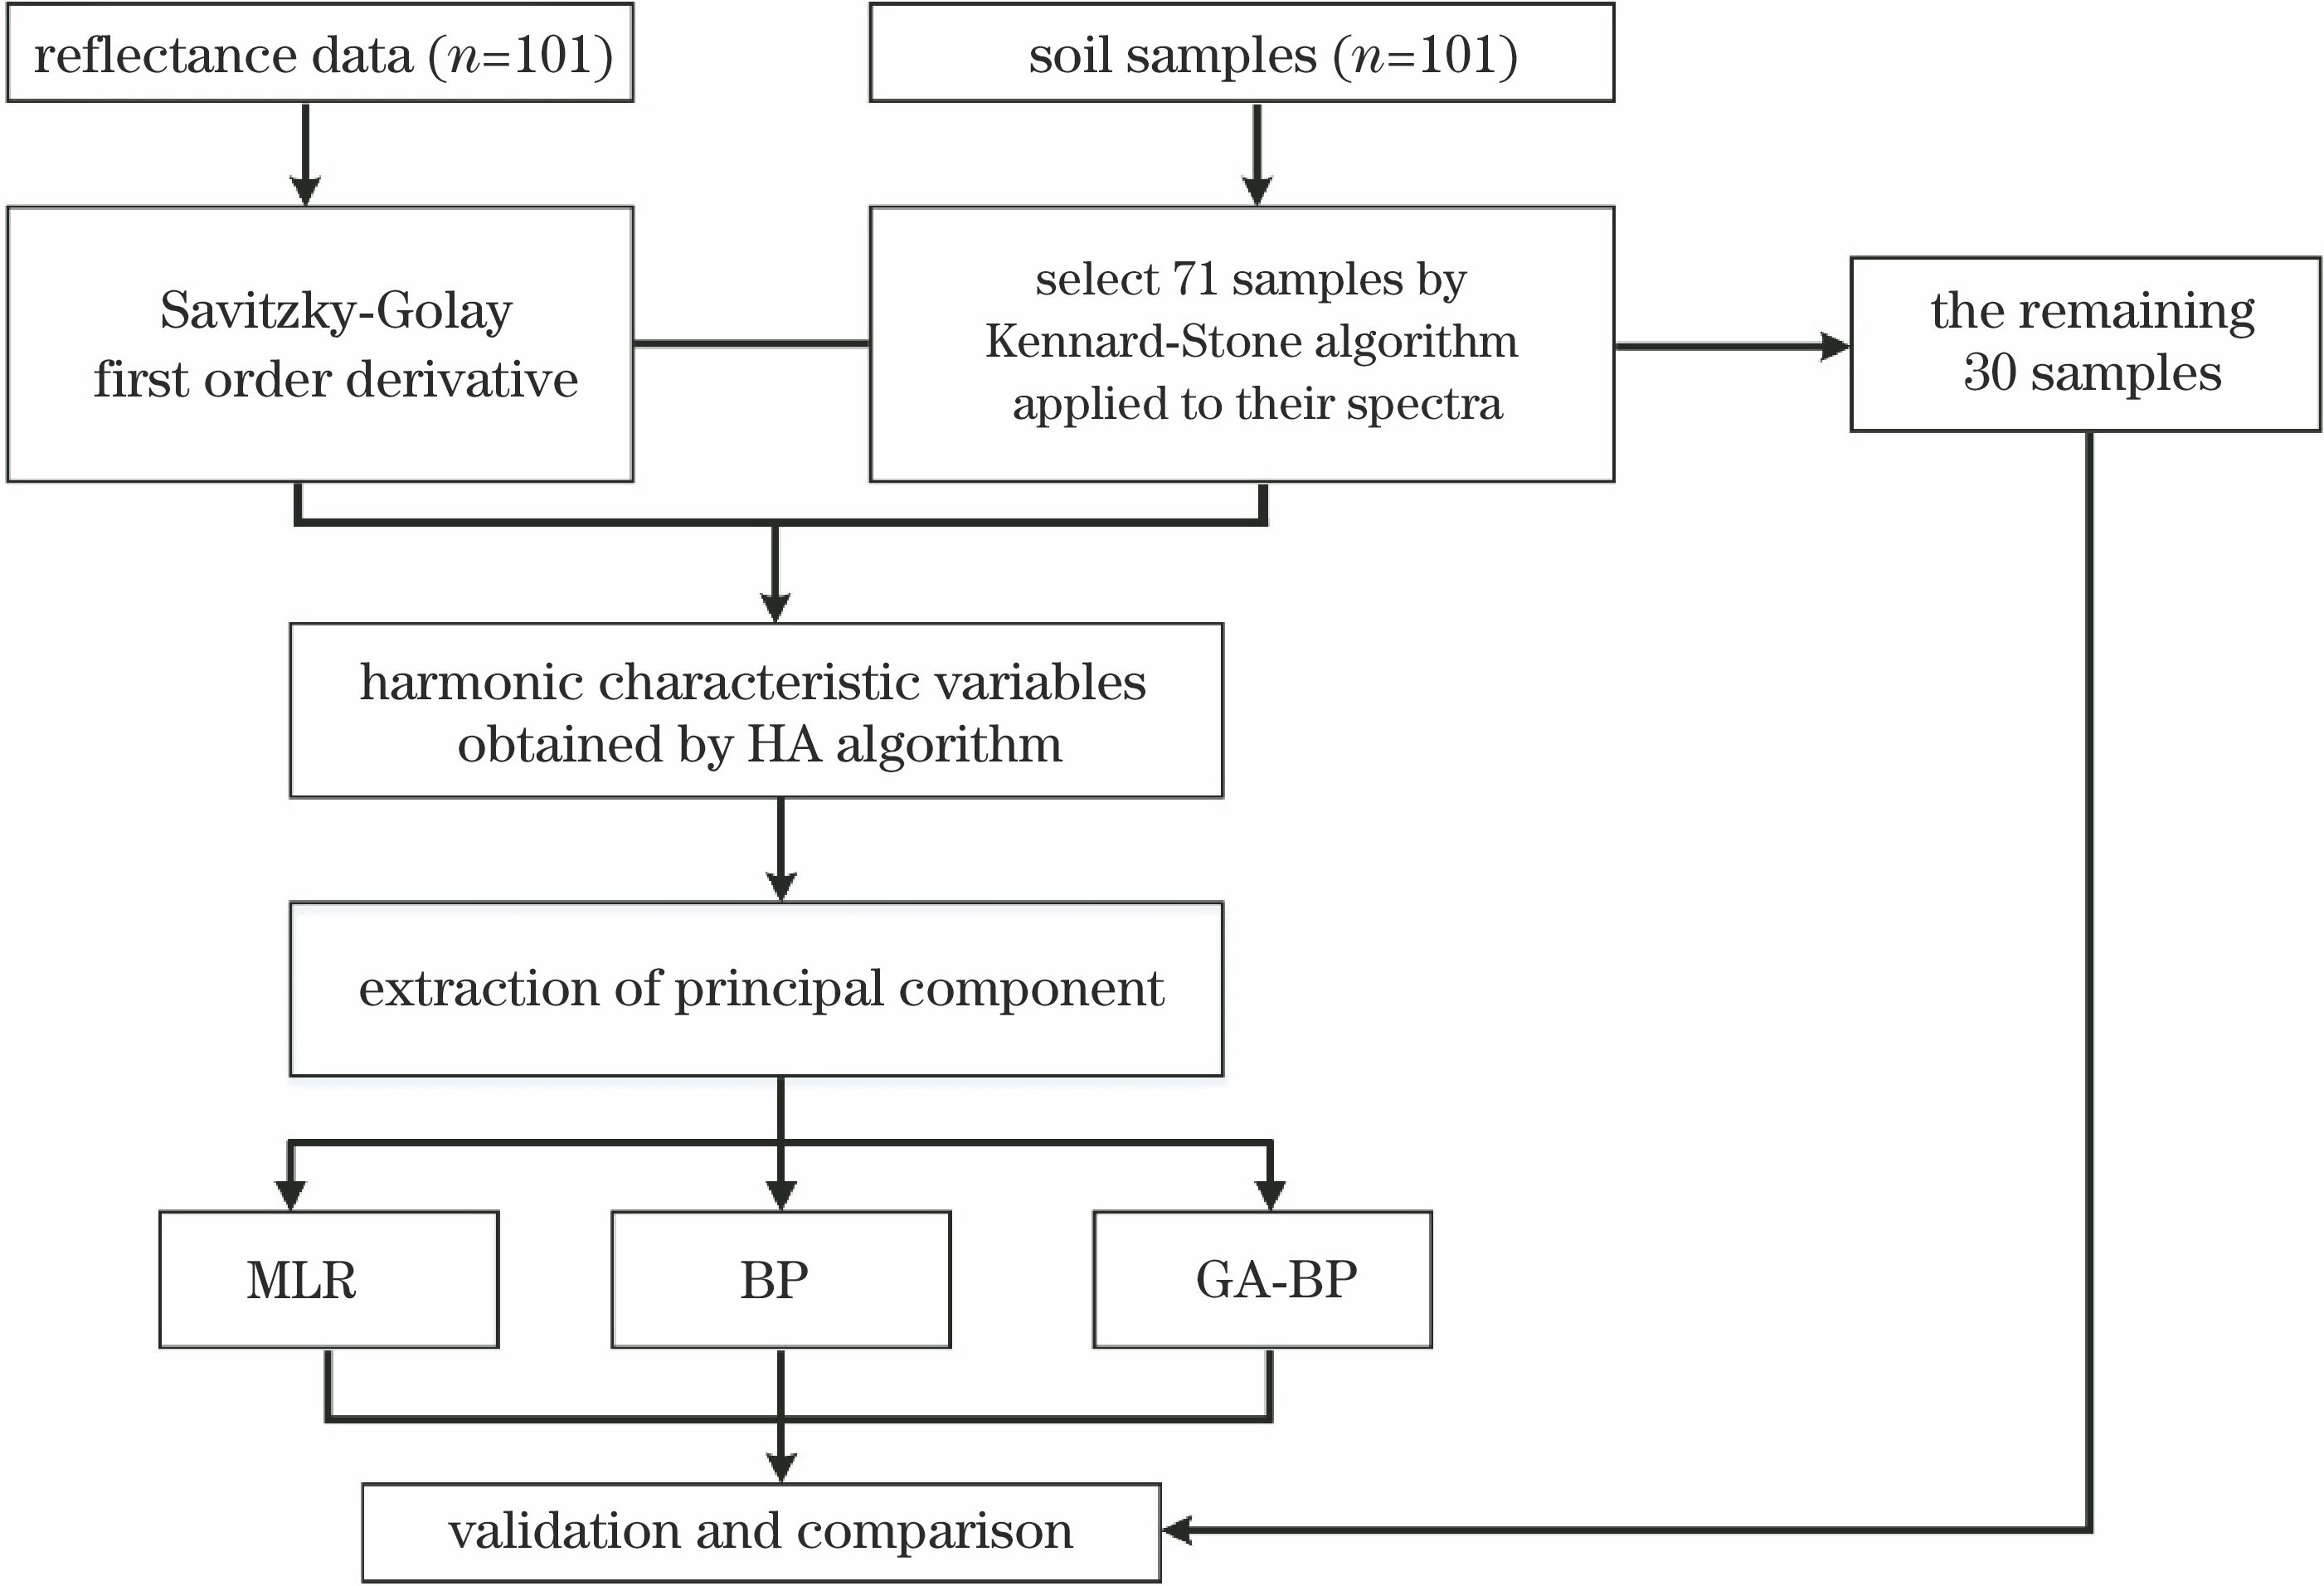
Fig. 2. Flow chart of SOM content estimation
Fig. 3. Correlation curves of original spectrum, FD spectrum and SOM content
Fig. 4. Correlation coefficient diagrams of harmonic component and SOM content at different HA times. (a)(e)(i)(m) Correlation coefficient of At and SOM content; (b)(f)(j)(n) correlation coefficient of Bt and SOM content; (c)(g)(k)(o) correlation coefficient of Ct and SOM content; (d)(h)(l)(p) correlation coefficient of φt and SOM content
Fig. 5. Technology roadmap of GA-BP neural network
Fig. 6. Changing curve of optimal individual fitness
Fig. 7. Measured and estimated SOM content for different models. (a) MLR model; (b) BP model; (c) GA-BP model
| Type of samples | Number of sample | SOM content (mass fraction) /10-3 | Standard deviation /10-3 | Coefficient of variation /% |
|---|
| Minimum | Maximum | Mean |
|---|
| Whole set | 101 | 2.32 | 18.06 | 10.94 | 3.45 | 31.51 | | Calibration set | 71 | 3.68 | 18.06 | 10.91 | 3.45 | 31.61 | | Validation set | 30 | 2.32 | 16.45 | 11.04 | 3.51 | 31.79 |
|
Table 1. Statistical characteristics of SOM content
| Harmonic decomposition times | Maximum positive correlation coefficient | Harmonic characteristic component | Maximum negative correlation coefficient | Harmonic characteristic component |
|---|
| 500 | 0.57 | 7 | -0.54 | 1 | | 1000 | 0.57 | 7 | -0.54 | 1 | | 1500 | 0.57 | 7 | -0.54 | 1 | | 2000 | 0.57 | 7,1993 | -0.54 | 1,1999 | | 2500 | 0.57 | 7,1993,2007 | -0.54 | 1,1999,2001 | | 3000 | 0.57 | 7,1993,2007 | -0.54 | 1,1999,2001 | | 3500 | 0.57 | 7,1993,2007 | -0.54 | 1,1999,2001 | | 4000 | 0.57 | 7,1993,2007,3993 | -0.54 | 1,1999,2001,3999 |
|
Table 2. Statistical characteristics of correlation coefficients between At and SOM content at different HA times
| Harmonic decomposition times | Maximum positive correlation coefficient | Harmonic characteristic component | Maximum negative correlation coefficient | Harmonic characteristic component |
|---|
| 500 | 0.54 | 21 | -0.51 | 4 | | 1000 | 0.54 | 21 | -0.51 | 4 | | 1500 | 0.54 | 21 | -0.51 | 4 | | 2000 | 0.54 | 21 | -0.51 | 1979 | | 2500 | 0.54 | 21,2021 | -0.51 | 1979 | | 3000 | 0.54 | 21,2021 | -0.51 | 1979 | | 3500 | 0.54 | 21,2021 | -0.51 | 1979 | | 4000 | 0.54 | 21,2021 | -0.51 | 1979,3979 |
|
Table 3. Statistical characteristics of correlation coefficient between Bt and SOM content at different HA times
| Harmonic decomposition times | Maximum positive correlation coefficient | Harmonic characteristic component | Maximum negative correlation coefficient | Harmonic characteristic component |
|---|
| 500 | 0.47 | 1 | -0.56 | 6 | | 1000 | 0.47 | 1 | -0.56 | 6 | | 1500 | 0.47 | 1 | -0.56 | 6 | | 2000 | 0.47 | 1,1999 | -0.56 | 6,1994 | | 2500 | 0.47 | 1,1999,2001 | -0.56 | 6,1994,2006 | | 3000 | 0.47 | 1,1999,2001 | -0.56 | 6,1994,2006 | | 3500 | 0.47 | 1,1999,2001 | -0.56 | 6,1994,2006 | | 4000 | 0.47 | 1,1999,2001,3999 | -0.56 | 6,1994,2006,3994 |
|
Table 4. Statistical characteristics of correlation coefficient between Ct and SOM content at different HA times
| Harmonic decomposition times | Maximum positive correlation coefficient | Harmonic characteristic component | Maximum negative correlation coefficient | Harmonic characteristic component |
|---|
| 500 | 0.30 | 68 | -0.30 | 20 | | 1000 | 0.30 | 68 | -0.32 | 532 | | 1500 | 0.30 | 68 | -0.32 | 532 | | 2000 | 0.32 | 1468 | -0.32 | 532 | | 2500 | 0.32 | 1468 | -0.32 | 532 | | 3000 | 0.32 | 1468 | -0.32 | 532,2532 | | 3500 | 0.32 | 1468,3468 | -0.32 | 532,2532 | | 4000 | 0.32 | 1468,3468 | -0.32 | 532,2532 |
|
Table 5. Statistical characteristics of correlation coefficient between φt and SOM content at different HA times
| Principle component | Characteristic value | Variance contribution /% | Accumulative contribution /% |
|---|
| PCA1 | 16.33 | 77.80 | 77.80 | | PCA2 | 1.45 | 6.91 | 84.71 | | PCA3 | 1.09 | 5.19 | 89.90 | | PCA4 | 0.91 | 4.34 | 94.24 | | PCA5 | 0.52 | 2.58 | 96.82 | | PCA6 | 0.26 | 1.43 | 98.25 | | PCA7 | 0.16 | 0.88 | 99.13 | | … | … | … | … | | PCA21 | -3.13×10⁻¹⁶ | -1.49×10⁻¹⁵ | 100 |
|
Table 6. Characteristic value of PCA and variance contribution rate
| Validation model | R2 | RMSEP /10-3 | RPD |
|---|
| MLR | 0.77 | 4.76 | 1.59 | | BP | 0.87 | 4.07 | 1.85 | | GA-BP | 0.92 | 3.92 | 1.93 |
|
Table 7. Accuracy statistical results of different estimate models