• Acta Optica Sinica
  • Vol. 42, Issue 19, 1912002 (2022)
Dong Pu1、2、3, Cheng Liu1、2, Hua Tao1、2, Yaping Ge1、2, and Jianqiang Zhu1、2、*
Author Affiliations
  • 1Joint Laboratory on High Power Laser and Physics, Shanghai Institute of Optics and Fine Mechanics, Chinese Academy of Sciences, Shanghai 201800, China
  • 2Joint Laboratory on High Power Laser and Physics, China Academy of Engineering Physics, Chinese Academy of Sciences, Shanghai 201800, China
  • 3Center of Materials Science and Optoelectronics Engineering, University of Chinese Academy of Science, Beijing 100049, China
  • show less
    DOI: 10.3788/AOS202242.1912002 Cite this Article Set citation alerts
    Dong Pu, Cheng Liu, Hua Tao, Yaping Ge, Jianqiang Zhu. Relative Translation Calibration of Multi-Frame Images in Iterative Reconstruction Method for Optical Transfer Function Measurement[J]. Acta Optica Sinica, 2022, 42(19): 1912002 Copy Citation Text show less
    Iterative reconstruction method for measurement of OTF based on multi-frame images. (a) Experiment setup; (b) process schematic
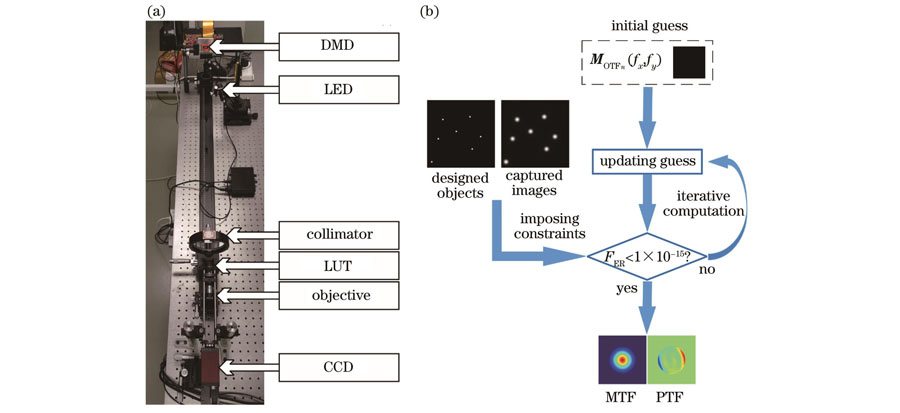
    Fig. 1. Iterative reconstruction method for measurement of OTF based on multi-frame images. (a) Experiment setup; (b) process schematic
    Schematic diagram for relative translations of points 1-3 to ideal point 0. (a) Uncorrected condition; (b) corrected condition
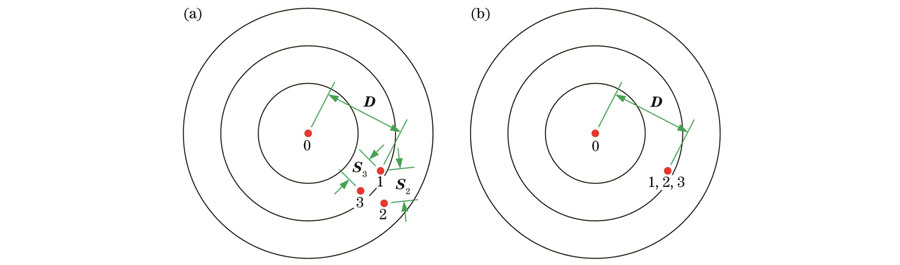
    Fig. 2. Schematic diagram for relative translations of points 1-3 to ideal point 0. (a) Uncorrected condition; (b) corrected condition
    Phase with 1.234 pixel translation in both x and y directions within cutoff frequency. (a) Ideal result; (b) PTF result after iterating once
    Fig. 3. Phase with 1.234 pixel translation in both x and y directions within cutoff frequency. (a) Ideal result; (b) PTF result after iterating once
    Simulated phase diagrams after introducing coma aberration. (a) PTF caused by coma aberration; (b) phase of random translation in image 1; (c) PTF result of image 1 after iterating once; (d) phase of random translation in image 2; (e) PTF result of image 2 after iterating once
    Fig. 4. Simulated phase diagrams after introducing coma aberration. (a) PTF caused by coma aberration; (b) phase of random translation in image 1; (c) PTF result of image 1 after iterating once; (d) phase of random translation in image 2; (e) PTF result of image 2 after iterating once
    Comparison between theoretical phase difference and calculated phase difference. (a) PTF result of image 1 after iterating once; (b) PTF result of image 2 after iterating once; (c) ideal translation phase difference between image 1 and image 2; (d) calculated translation phase difference between image 1 and image 2
    Fig. 5. Comparison between theoretical phase difference and calculated phase difference. (a) PTF result of image 1 after iterating once; (b) PTF result of image 2 after iterating once; (c) ideal translation phase difference between image 1 and image 2; (d) calculated translation phase difference between image 1 and image 2
    Object pattern and captured image. (a) One of object patterns; (b) complete image corresponding to Fig. 6(a); (c) partial picture of object pattern; (d) partial picture corresponding to Fig. 6 (c)
    Fig. 6. Object pattern and captured image. (a) One of object patterns; (b) complete image corresponding to Fig. 6(a); (c) partial picture of object pattern; (d) partial picture corresponding to Fig. 6 (c)
    OTF measurement results by calculation. (a) Two-dimensional MTF; (b) two-dimensional PTF;(c) corrected MTF
    Fig. 7. OTF measurement results by calculation. (a) Two-dimensional MTF; (b) two-dimensional PTF;(c) corrected MTF
    Relative translation /pixelMSE /10-4
    First simulationSecond simulationThird simulation
    0.0010.71720.43170.6842
    0.0100.71720.43170.6842
    0.1000.71720.43170.6842
    0.5000.71720.43170.6842
    1.2340.71720.43170.6842
    Table 1. Mean square error between calculated PTF and ideal phase under diffraction limit

    Relative translation

    /pixel

    With correctionWithout correction
    Number of iterationsMSE /10-7Number of iterationsMSE /10-7
    0.70±0.5070.6892391.042
    0.70±1.0080.87173929.97
    1.00±0.5080.8160431.715
    1.00±1.0070.90294231.02
    Table 2. Effects of correction and non-correction of relative translation on number of iterations and mean square error under different translations
    Dong Pu, Cheng Liu, Hua Tao, Yaping Ge, Jianqiang Zhu. Relative Translation Calibration of Multi-Frame Images in Iterative Reconstruction Method for Optical Transfer Function Measurement[J]. Acta Optica Sinica, 2022, 42(19): 1912002
    Download Citation