
Zhi-Ben Zhuang, Jun Li, Jing-Yi Liu, Shi-Qiang Chen. Image encryption algorithm based on new five-dimensional multi-ring multi-wing hyperchaotic system [J]. Acta Physica Sinica, 2020, 69(4): 040502-1
- Acta Physica Sinica
- Vol. 69, Issue 4, 040502-1 (2020)
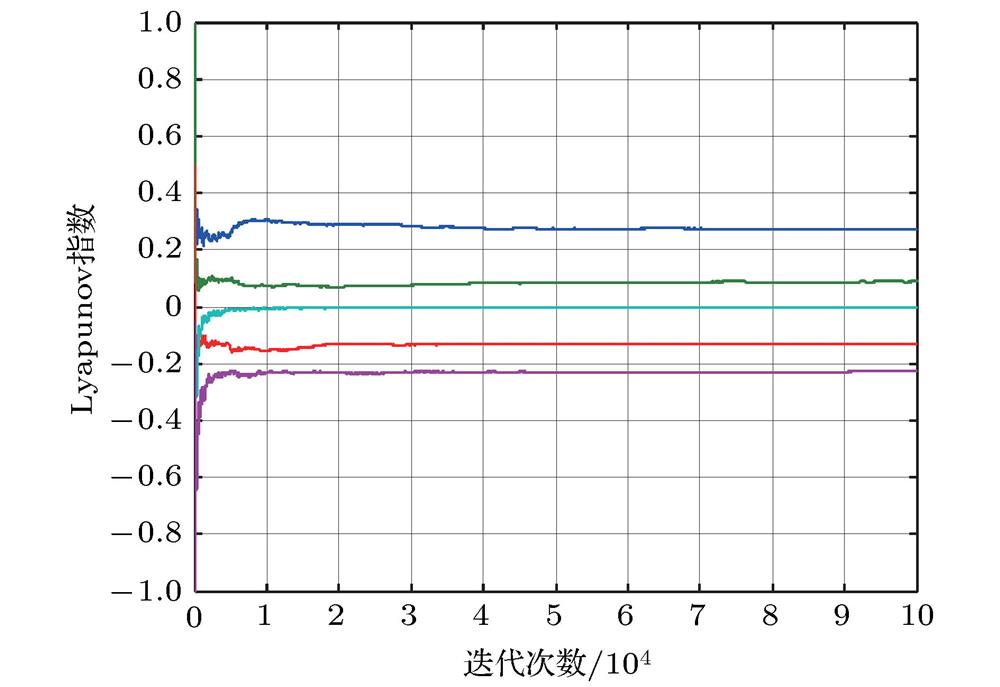
Fig. 1. Lyapunov exponent diagram.
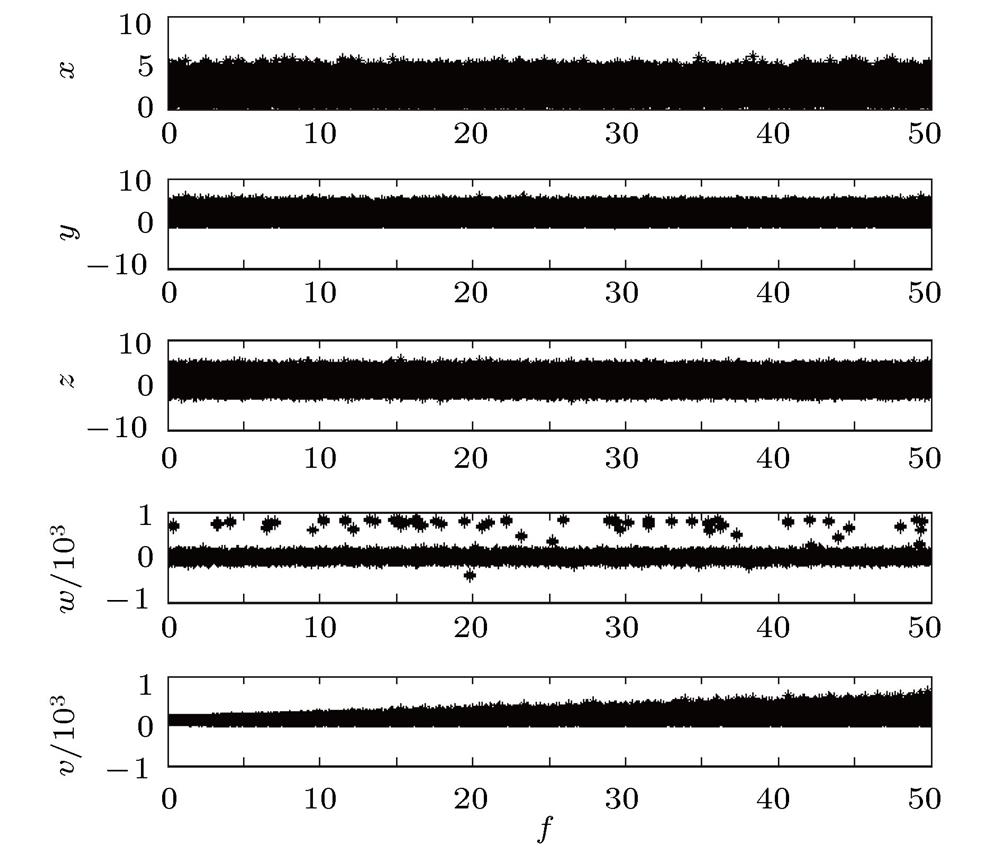
Fig. 2. Bifurcation diagram of system (2) variation with
 .
.
. Fig. 3. Time series diagram: (a)
 time series; (b)
 time series; (c)
 time series; (d)
 time series; (e)
 time series
time series; (b)
time series; (c)
time series; (d)
time series; (e)
time series Fig. 4. Three-dimensional phase diagram: (a)
 Three-dimensional map; (b)
 Three-dimensional map; (c)
 Three-dimensional map; (d)
 Three-dimensional map; (e)
 Three-dimensional map; (f)
 Three-dimensional map; (g)
 Three-dimensional map; (h)
 Three-dimensional map; (i)
 Three-dimensional map; (j)
 Three-dimensional map.
Three-dimensional map; (b)
Three-dimensional map; (c)
Three-dimensional map; (d)
Three-dimensional map; (e)
Three-dimensional map; (f)
Three-dimensional map; (g)
Three-dimensional map; (h)
Three-dimensional map; (i)
Three-dimensional map; (j)
Three-dimensional map. Fig. 5. Two-dimensional plane phase diagram: (a)
 flat; (b)
 flat; (c)
 flat; (d)
 flat; (e)
 flat; (f)
 flat; (g)
 flat.
flat.
flat; (b)
flat; (c)
flat; (d)
flat; (e)
flat; (f)
flat; (g)
flat. Fig. 6. Digital image encryption and decryption experiment: (a) Original Lena image; (b) encrypted Lena image; (c) decrypted Lena image; (d) original baboon image; (e) encrypted baboon image; (f) decrypted baboon image; (g) original boat image.; (h) encrypted boat image; (i)decrypted boat image.
Fig. 7. Histogram of plaintext and ciphertext images (a) Plaintext Lena image histogram; (b) ciphertext Lena image histogram; (c) plaintext baboon image histogram; (d) ciphertext baboon image histogram; (e) plaintext boat image histogram; (f) ciphertext boat image histogram.
Fig. 8. Key sensitivity tests: (a) Plain-image; (b) cipher
 with key
 ; (c) cipher
 with key
 ; (d) right decrypted
 ; (e) decrypted
 with
with
 ; (f) decrypted
 with
with
 .
.
with key
; (c) cipher
with key
; (d) right decrypted
; (e) decrypted
with
; (f) decrypted
with
. Fig. 9. Correlation analysis chart in three directions before and after baboon image encryption: (a), (b) Diagonally adjacent; (c), (d) horizontally adjacent; (e), (f) vertically adjacent.
Fig. 10. Anti-shear attack capability analysis chart: (a) Ciphertext before cutting; (b) ciphertext after cutting; (c) decrypted image before cutting; (d) decrypted image after cutting.
Fig. 11. Anti-noise attack capability analysis chart: (a) Ciphertext before adding noise; (b) ciphertext after adding noise; (c) decrypted image before adding noise; (d) decrypted image after adding noise.
|
Table 1.
Information entropy analysis table of plain text and encrypted image.
明文图像与加密图像的信息熵分析表
|
Table 2.
Encrypted image fixed point ratio analysis table.
加密图像不动点比分析表
|
Table 3.
Grayscale average change value analysis table.
灰度平均变化值分析表
| |||||||||||||||||||||||||||||||||||||||||||||||||||||||||||||||||||
Table 4.
Key sensitivity test result table.
密钥敏感性测试结果表
| ||||||||||||||||||||||||||||||||||||||
Table 5.
Plaintext image and ciphertext image correlation coefficient test result table.
明文图像与密文图像相关系数测试结果表

Set citation alerts for the article
Please enter your email address
© Copyright 2018-2021 | Chinese Laser Press. All Rights Reserved 沪ICP备15018463号-20