
Wenfang Sun. Nonlinear absorption and optical limiting of platinum(Ⅱ) terpyridine complexes (Invited)[J]. Infrared and Laser Engineering, 2020, 49(12): 20201078
- Infrared and Laser Engineering
- Vol. 49, Issue 12, 20201078 (2020)
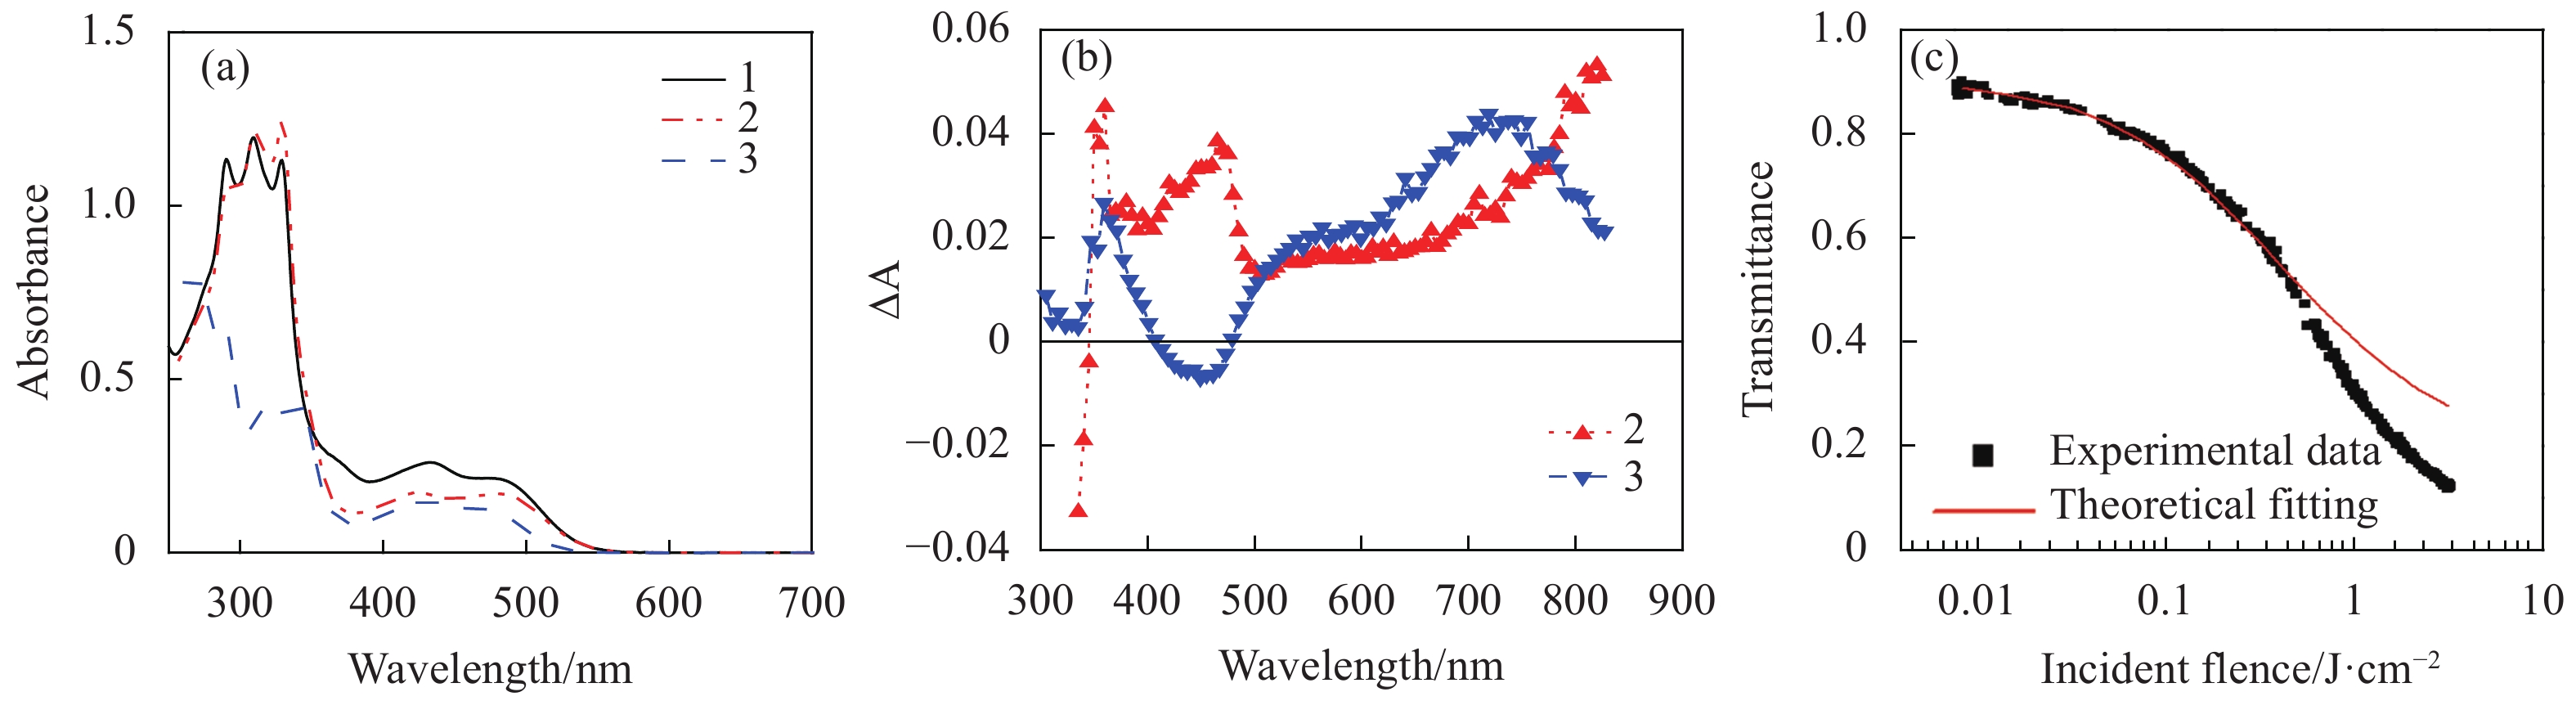
Fig. 1. Representative structures for the most commonly studied square-planar Pt(II) complexes
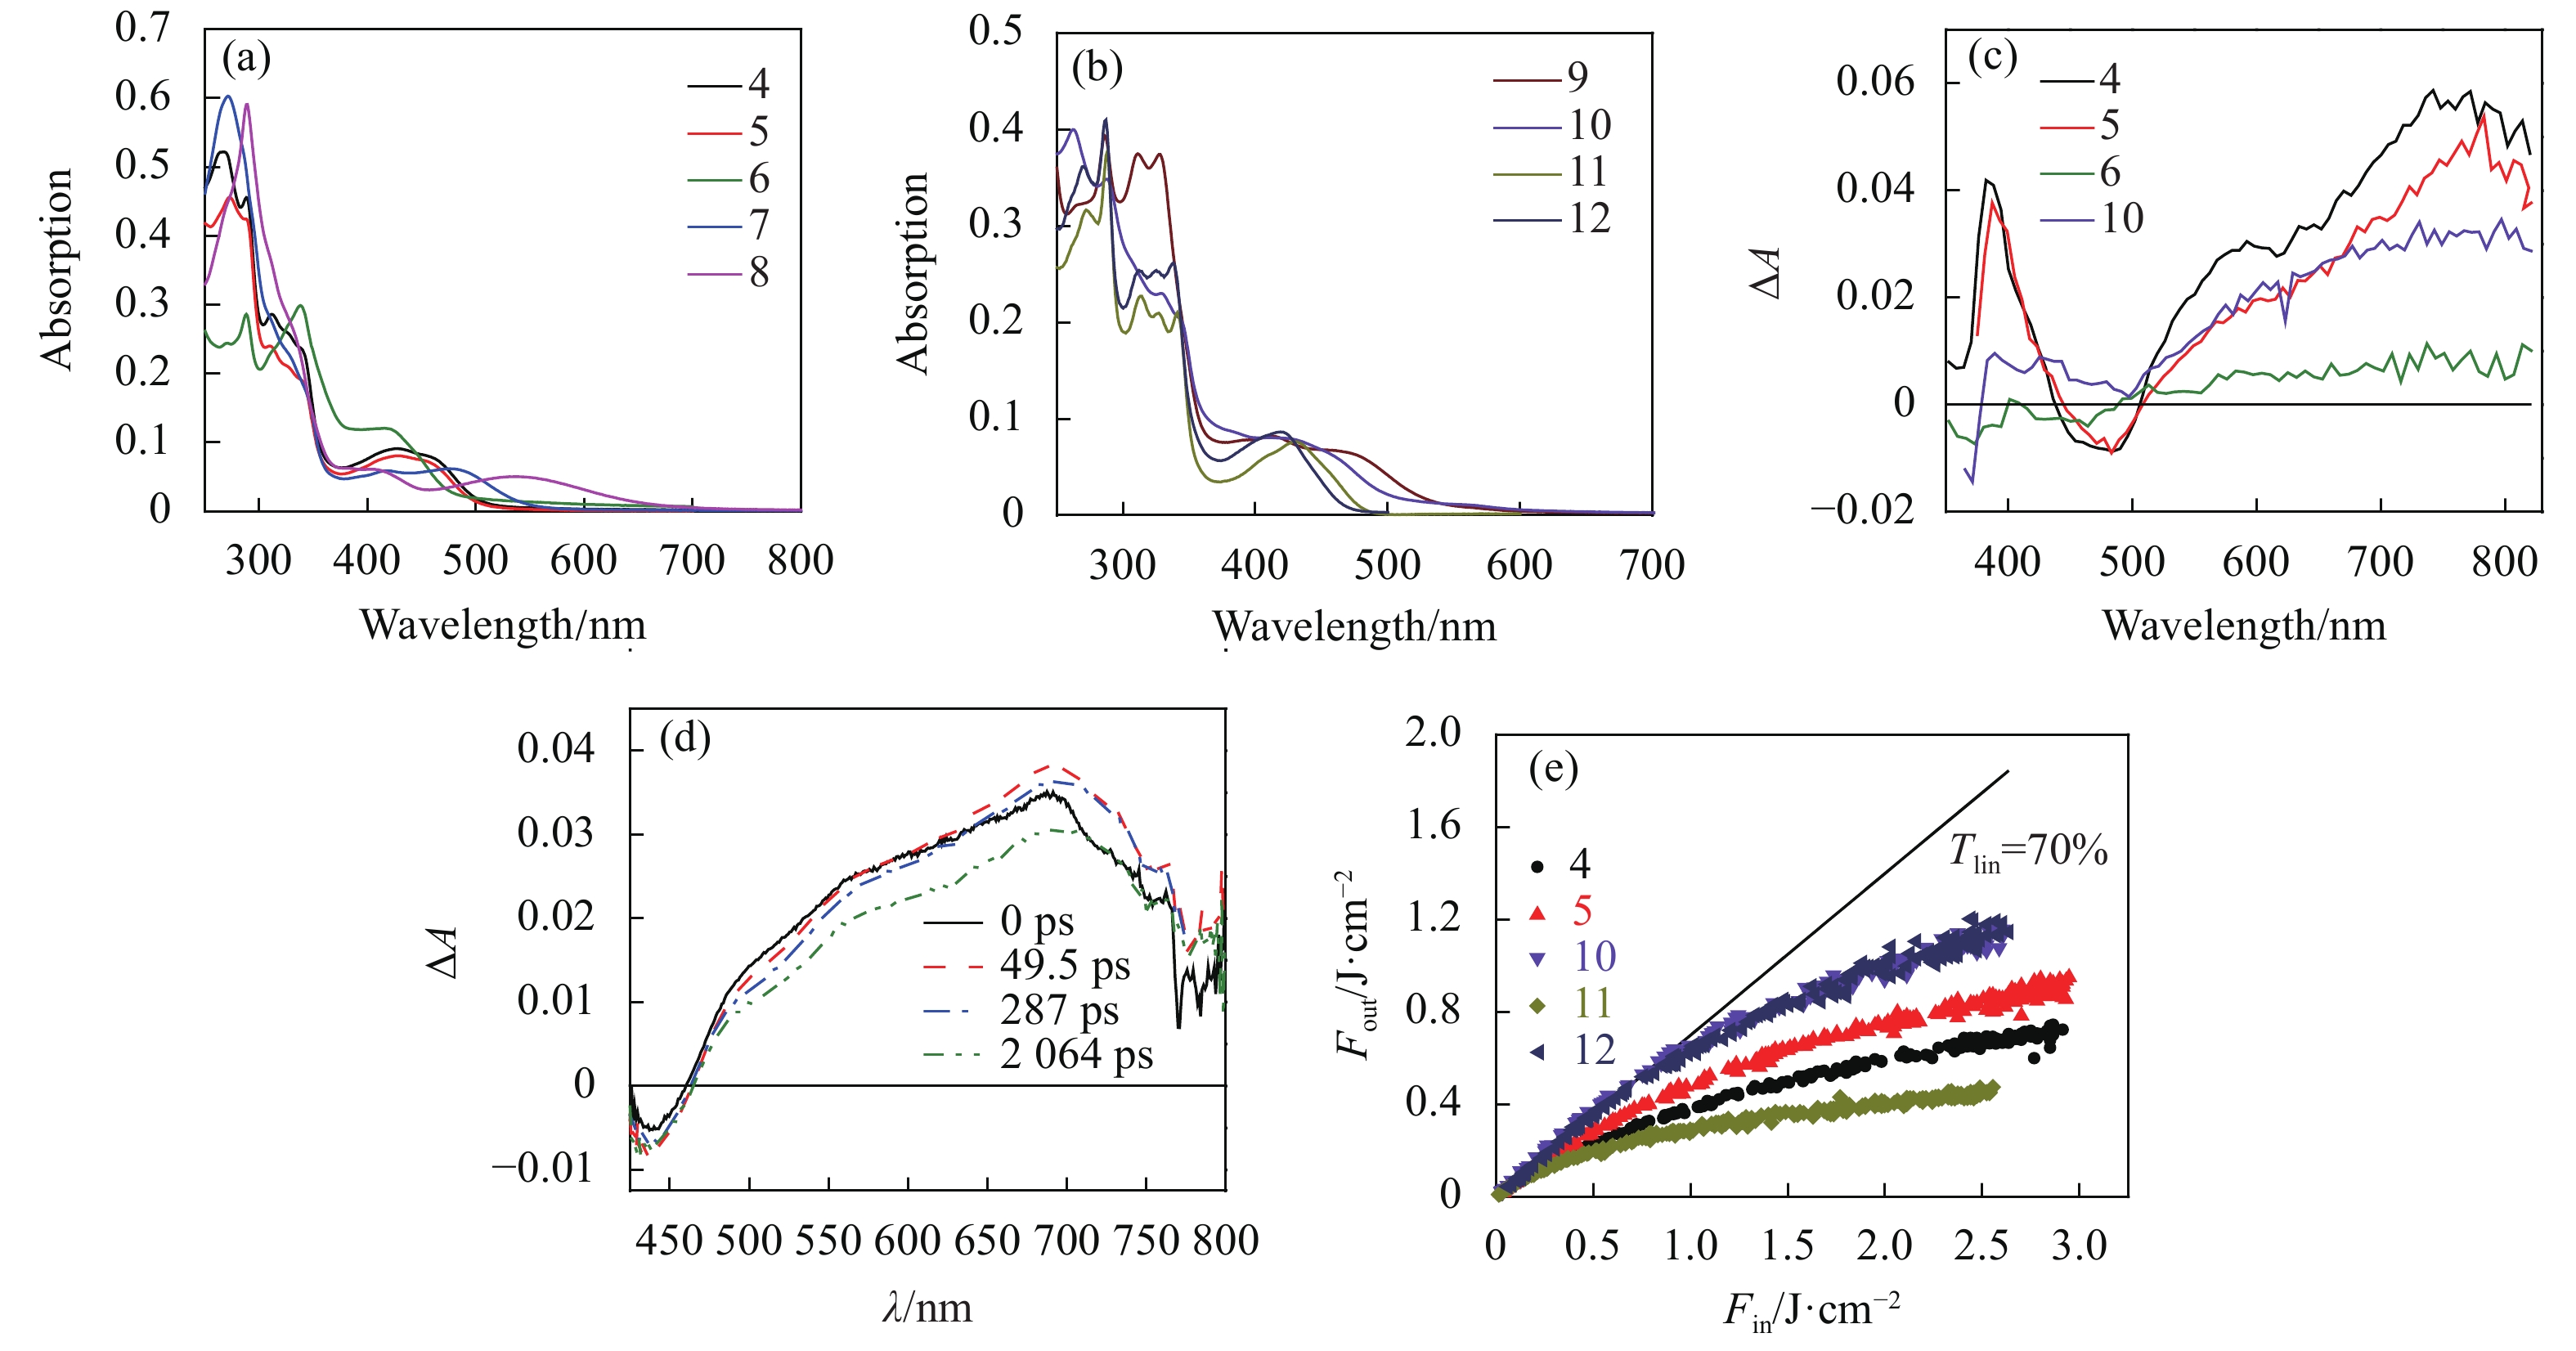
Fig. 2. Structures of Pt(Ⅱ) terpyridine acetylide complexes 1 -22 with different substituents on the acetylide ligand or on the terpyridine ligand
Fig. 3. (a) Linear absorption spectra of complexes 1-3 (8.8×10⁻⁵ mol/L) in CH2Cl2/CH3OH (8∶2) in a 2 mm cell, (b) triplet transient difference absorption (TA) spectra of 2 (2.39×10⁻⁵ mol/L) and 3 (2.09×10⁻⁵ mol/L) in a 1-cm cell. The TA spectrum of 1 was similar to that of 2 , thus was not shown in Fig.3(b) , (c) Z-scan experimental data and fitting curve for 3 in CH2Cl2/CH3OH (8∶2) with a concentration of 3×10⁻⁴ mol/L and a linear transmission of 95% at 532 nm in a 1 mm cell. Figures a and b are modified from Ref. [50] with permission, copyright © American Institute of Physics
Fig. 4. (a) and (b) Linear absorption spectra of complexes 4-12 (1×10⁻⁵ mol/L) in acetonitrile in a 1 cm cuvette, (c) ns TA spectra of 4, 5, 6 and 10 in acetonitrile in a 1 cm cell (A = 0.4 at 355 nm). See Ref. [51] for the ns TA spectra of 11 and 12 in acetonitrile, (d) time-resolved fs TA spectra of 11 in acetonitrile, (e) optical limiting curves of 4, 5, 10, 11 and 12 in acetonitrile in a 2 mm cell at 532 nm for 4.1 ns laser pulses. The linear transmission for all solutions was adjusted to 70% in the 2 mm cell. Figures are modified from Refs. [51] and [52] with permission, copyright © Chinese Optical Society and American Chemical Society, respectively
Fig. 5. (a) Linear absorption spectra of 19-22 (2.0×10⁻⁵ mol/L) in acetonitrile in a 1 cm cuvette, (b) ns TA spectra of 19-22 in acetonitrile in a 1 cm cell (A = 0.4 at 355 nm), (c) optical limiting curves of 19-22 in acetonitrile in a 2 mm cell at 532 nm for 4.1 ns laser pulses. The linear transmission for all solutions was adjusted to 70% at 532 nm in the 2 mm cell. Figures are modified from Ref. [53] with permission, copyright © American Chemical Society
Fig. 6. Structures of Pt(N^N^N) complexes 23 -32
Fig. 7. (a) Linear absorption spectra of 23-27 in CH2Cl2, (b) ns time-resolved TA spectra of 25 in CH2Cl2 in a 1 cm cell (6.2×10⁻⁵ mol/L (A 355 = 0.888)), (c) ns time-resolved TA spectra of 26 in CH2Cl2 in a 1 cm cell (3.9×10⁻⁵ mol/L (A 355 = 0.564)), (d) optical limiting curves of 25-27 in a 2 mm cell at 532 nm for 4.1 ns laser pulses. The linear transmission for all solutions was adjusted to 70% at 532 nm in the 2 mm cell. 25 and 26 were dissolved in CH2Cl2, and 27 was dissolved in DMF. Figures are modified from Ref. [5] with permission, copyright © American Chemical Society
Fig. 8. (a) Linear absorption spectra of 28-32 in acetonitrile, (b) ns TA spectra of 28-32 in acetonitrile in a 1 cm cell (λ ex = 355 nm), (c) optical limiting curves of 28-32 in acetonitrile in a 2 mm cell at 532 nm for 4.1 ns laser pulses. The linear transmission for all solutions was adjusted to 75% at 532 nm in the 2 mm cell. Figures are modified from Ref.[56] with permission, copyright © American Chemical Society
Fig. 9. Structures of Pt(II) R-fluorenylterpyridine chloride complexes 33 -37
Fig. 10. (a) UV-vis absorption spectra in CH3CN for 33-35 , (b) time-resolved fs transient difference absorption spectra of 33 in CH3CN, (c) open-aperture Z-scan experimental data and fitting curve for 34 in CH3CN at 740 nm. The energy used for the experiment was 6.6 μJ, and the beam waist at the focal point was 31 μm. Figures are modified from Ref.[67] with permission, copyright © Wiley-VCH Verlag GmbH & Co. KGaA, Weinheim
Fig. 11. (a) UV-vis absorption spectra of 36 and 37 in DMSO, (b) nanosecond TA spectra of 36 and 37 in CH3CN immediately after laser excitation. λ ex = 355 nm. A 355 = 0.4 in a 1 cm cuvette. (c) optical limiting curves of 36 and 37 in DMSO solution for 4.1 ns laser pulses at 532 nm. The linear transmission of the solution was adjusted to 95% in a 2 mm cuvette. The beam waist at the focal plane was 72 μm, (d) wavelength dispersion of the ratios of excited-state absorption cross section to that of the ground-state absorption (σ ex/σ 0) and TPA cross section (σ 2) for 36 and 37 in DMSO solution. Figures are modified from Ref.[72] with permission, copyright © American Chemical Society
Fig. 12. Structures of mononuclear or multinuclear alkynylplatinum(Ⅱ) terpyridine complexes 38 -44
Fig. 13. Structures of a trinuclear RuPt2 and heptanuclear RuPt6 complexes 45 and 46
| ||||||||||||||||||||
Table 1. Optical limiting parameters at 532 nm for ns laser pulsesa
| ||||||||||||||||||||||||||||||||||||||||||||||||||||||||||||||||||
Table 2. Photophysical parameters and optical limiting data for 4 , 5 , 10 , 11 , 12 , and 19 -22 in acetonitrile[51,53]
| ||||||||||||||||||||||||||||||||||||||||||||||||||||||
Table 3. Photophysical parameters of 28-32 in CH3CN
| |||||||||||||||||||||||||||||||||||||||||||||||||||||||||||||||
Table 4. Ground-state and excited-state absorption cross sections of 28-32 in CH3CN at 532 nm
| ||||||||||||||||||||||||||||
Table 5. Singlet excited-state absorption cross sections of 28 at different wavelengthsa
| ||||||||||||||||||||||||||||||||||||||||||||||||||||||||||||||||||||||||||||||||||||||||||||||||||||||||||||
Table 6. Excited-state absorption and two-photon absorption cross sections for 33-35 at different wavelengths in CH3CN
| ||||||||||||||||
Table 7. Photophysical parameters of 36 and 37 a
| |||||||||||||||||||||||||||||||||||||||||||||||||||||||||||||||||||||||||||||||||||||||||||||||||||||||||||||||||||||||||||||||||||||||||||||||||||||||||||||||||||||||||||||||||||||||||||||||||||||||||||||||||||||||||||||||||||||||||
Table 8. Absorption cross sections of 36 and 37 at selected wavelengths determined by fitting of Z-scan data

Set citation alerts for the article
Please enter your email address
© Copyright 2018-2021 | Chinese Laser Press. All Rights Reserved 沪ICP备15018463号-20