• Acta Optica Sinica
  • Vol. 38, Issue 10, 1001004 (2018)
Dong Yang1、2、*, Wenqing Xu2、3, Qingshan Xu1、2、*, Heli Wei2、3、4, and Jianyu Li3、*
Author Affiliations
  • 1 Laboratotory of Photoelectric Detection, Center of Fundamental Science, Anhui Institute of Optics and Fine Mechanics, Chinese Academy of Sciences, Hefei, Anhui 230031, China
  • 2 Science Island Branch of Graduate School, University of Science and Technology of China, Hefei, Anhui 230031, China
  • 3 Key Laboratory of Atmospheric Optics, Anhui Institute of Optics and Fine Mechanics, Chinese Academy of Sciences, Hefei, Anhui 230031, China
  • 4 School of Environmental Science and Optoelectronic Technology, University of Science and Technology of China, Hefei, Anhui 230026, China
  • show less
    DOI: 10.3788/AOS201838.1001004 Cite this Article Set citation alerts
    Dong Yang, Wenqing Xu, Qingshan Xu, Heli Wei, Jianyu Li. Particle-Property Extraction Based on Scattering Ratio[J]. Acta Optica Sinica, 2018, 38(10): 1001004 Copy Citation Text show less
    Average phase function of cirrus cloud, water cloud and aerosol
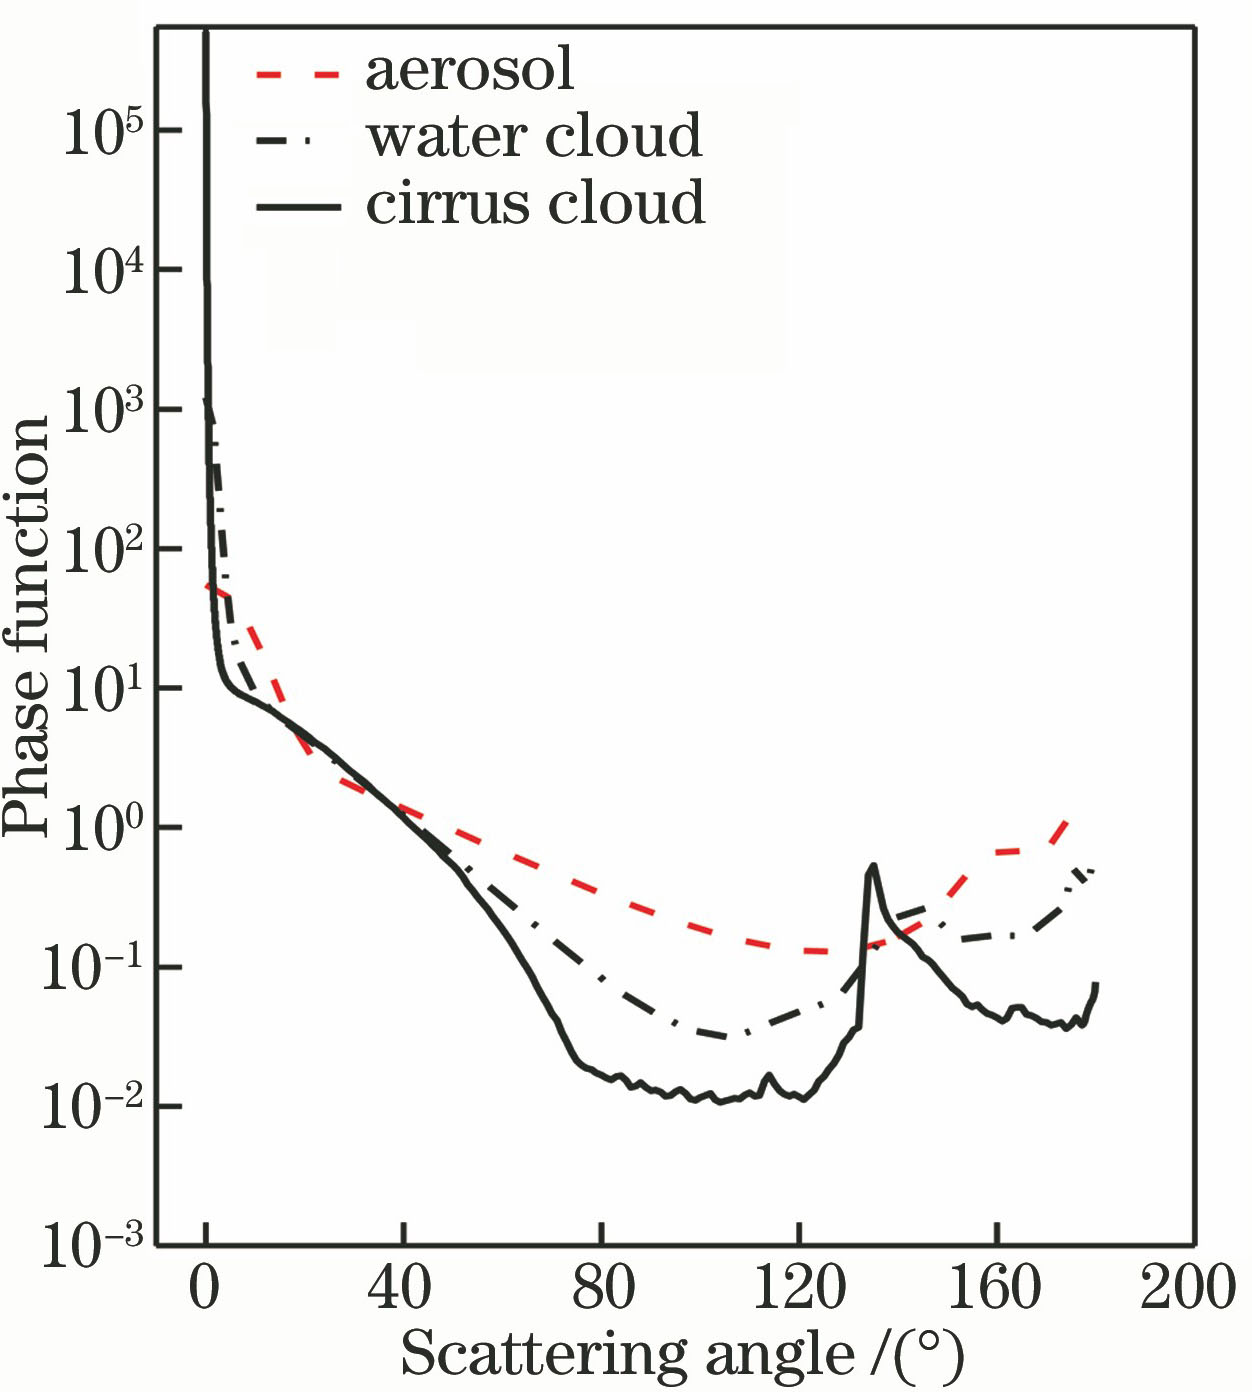
    Fig. 1. Average phase function of cirrus cloud, water cloud and aerosol
    Comparison of scattering distribution in forward small angle
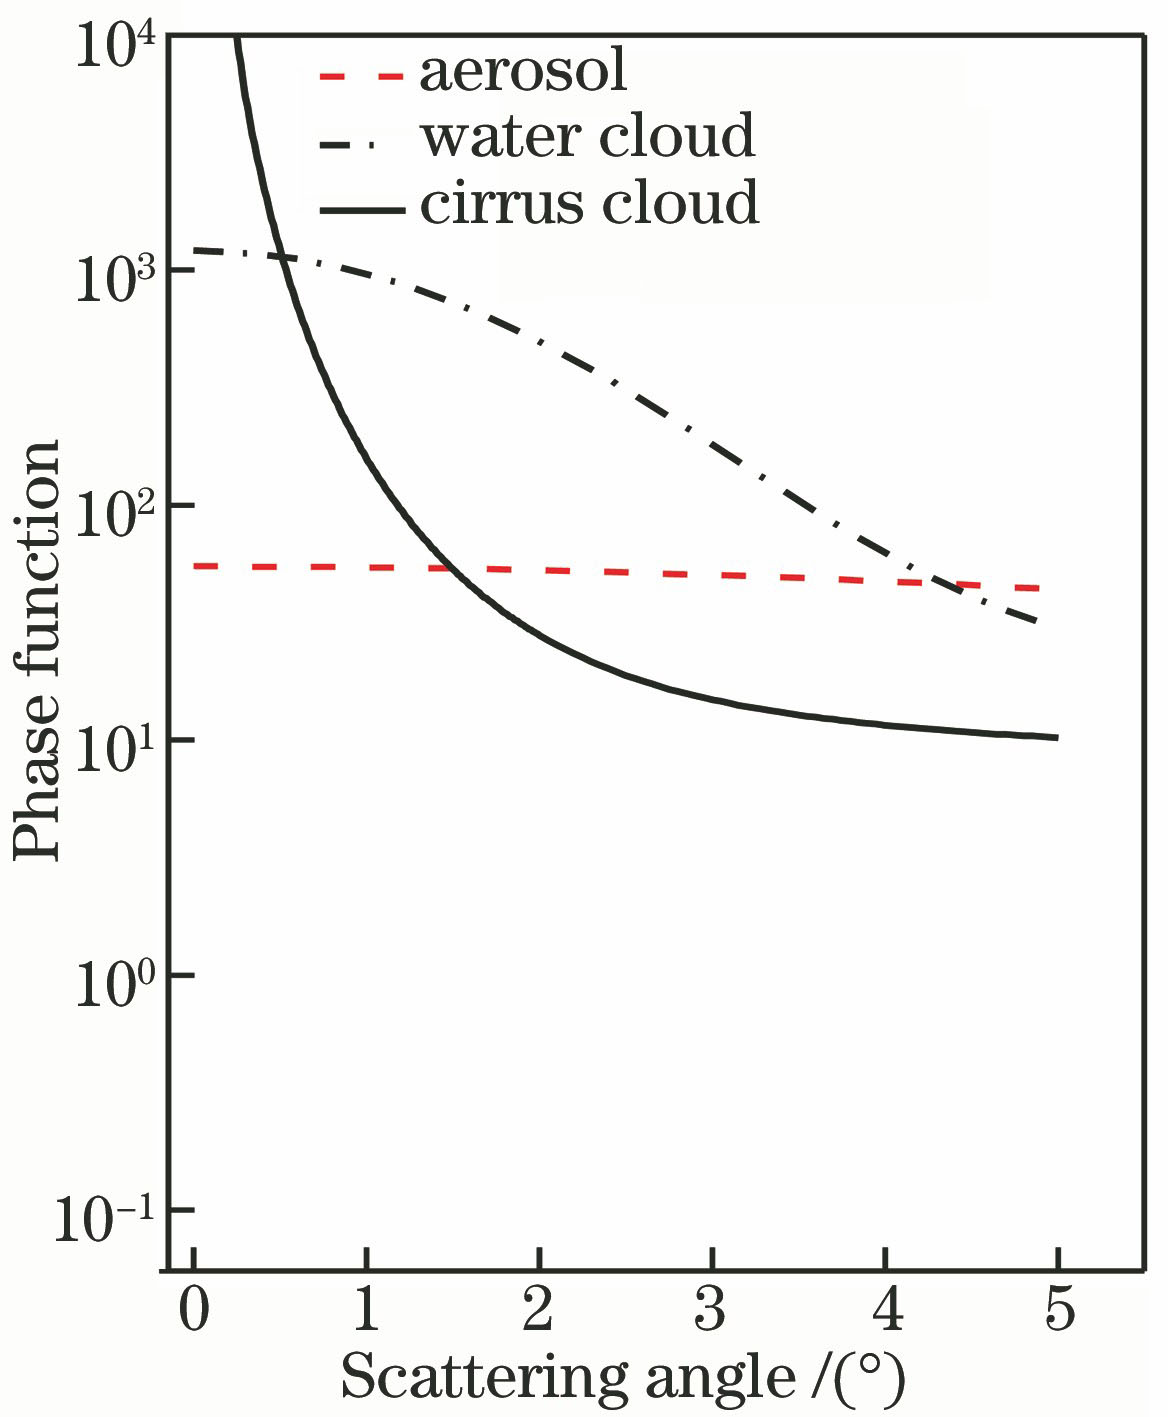
    Fig. 2. Comparison of scattering distribution in forward small angle
    Logarithmic ratio of scattering at different field of views. (a)Aerosol; (b)water cloud; (c)cirrus cloud
    Fig. 3. Logarithmic ratio of scattering at different field of views. (a)Aerosol; (b)water cloud; (c)cirrus cloud
    Comparison of aerosol optical thickness
    Fig. 4. Comparison of aerosol optical thickness
    Comparison between scattering logarithm ratio measured by VFOVSP and Angstrom coefficient calculated by POMO2 and optical thickness. (a) Clear weather; (b) thin cloud weather; (c) thick cloud weather
    Fig. 5. Comparison between scattering logarithm ratio measured by VFOVSP and Angstrom coefficient calculated by POMO2 and optical thickness. (a) Clear weather; (b) thin cloud weather; (c) thick cloud weather
    Change trend of optical thickness at 675-nm and 870-nm bands
    Fig. 6. Change trend of optical thickness at 675-nm and 870-nm bands
    Frequency distribution diagram of optical thickness appearing in cirrus
    Fig. 7. Frequency distribution diagram of optical thickness appearing in cirrus
    Dong Yang, Wenqing Xu, Qingshan Xu, Heli Wei, Jianyu Li. Particle-Property Extraction Based on Scattering Ratio[J]. Acta Optica Sinica, 2018, 38(10): 1001004
    Download Citation