
Rujian Sun, Ziwen Cao, Xiaoguang Ma, Zhigang Che, Shikun Zou, Junfeng Wu. Residual Stress and Fatigue Property of Laser Shock Peening 2050 Aluminum-Lithium Alloy[J]. Laser & Optoelectronics Progress, 2023, 60(1): 0114002
- Laser & Optoelectronics Progress
- Vol. 60, Issue 1, 0114002 (2023)
![Schematic of laser shock peening and its microstructural evolution in the peened region[8]](/richHtml/lop/2023/60/1/0114002/img_01.jpg)
Fig. 1. Schematic of laser shock peening and its microstructural evolution in the peened region[8]
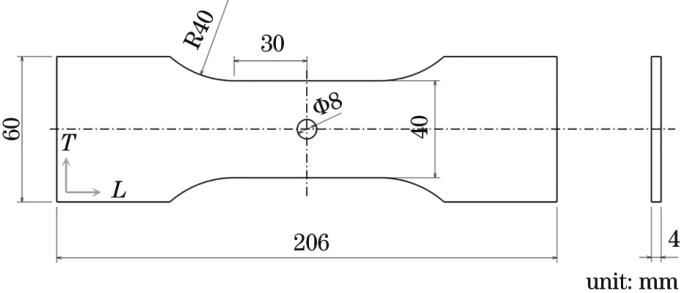
Fig. 2. Design of hole fatigue specimen
Fig. 3. Residual stress specimen after laser shock strengthening. (a) Round spot peening; (b) square spot peening
Fig. 4. Evolution of range value with four different factors in the round spot peening case
Fig. 5. Changing of K values at three different levels with regards to four different factors in the round spot peening case. (a) Laser power density; (b) overlapping rate; (c) impact times; (d) specimen thickness
Fig. 6. Evolution of range value with four different factors in the square spot peening case
Fig. 7. Changing of K values at three different levels with regards to four different factors in the square spot peening case. (a) Laser power density; (b) overlapping rate; (c) impact times; (d) specimen thickness
Fig. 8. Residual stress test results of round spot with laser power density of 5.30 GW·cm-2, overlapping rate of 50%, and peened twice
Fig. 9. Fatigue lives of round spot with laser power density of 5.30 GW·cm-2, overlapping rate of 50%, and peened twice
|
Table 1. Chemical composition of 2050 aluminum-lithium alloy
|
Table 2. Physical and mechanical properties of 2050 aluminum-lithium alloy
| ||||||||||||||||||||||||||||
Table 3. Factors and levels of orthogonal experiment for residual stress analysis
| |||||||||||||||||||||||||||||||||||||||||||||||||||||||||||||||||||||||||||||||||||||||||
Table 4. Design of orthogonal experiment table for residual stress analysis
| |||||||||||||||||||||||||||||||||||||||||||||||||||||||||||||||||||||||||||||||||||||||||
Table 5. Residual stress along L direction in round spot peening case
| |||||||||||||||||||||||||||||||||||||||||||||||||||||||||||||||||||||||||||||||||||||||||
Table 6. Residual stress along T direction in round spot peening case
| |||||||||||||||||||||||||||||||||||||||||||||||||||||||||||||||||||||||||||||||||||||||||
Table 7. Residual stress along L direction in square spot peening case
| |||||||||||||||||||||||||||||||||||||||||||||||||||||||||||||||||||||||||||||||||||||||||
Table 8. Residual stress along T direction in square spot peening case

Set citation alerts for the article
Please enter your email address
© Copyright 2018-2021 | Chinese Laser Press. All Rights Reserved 沪ICP备15018463号-20