
Ling Wang, Jian Hao, Zhongkun Wang, Mingen Xu. Study on Manufacturing-Aid Optical Coherence Tomography[J]. Acta Optica Sinica, 2020, 40(11): 1111003
- Acta Optica Sinica
- Vol. 40, Issue 11, 1111003 (2020)
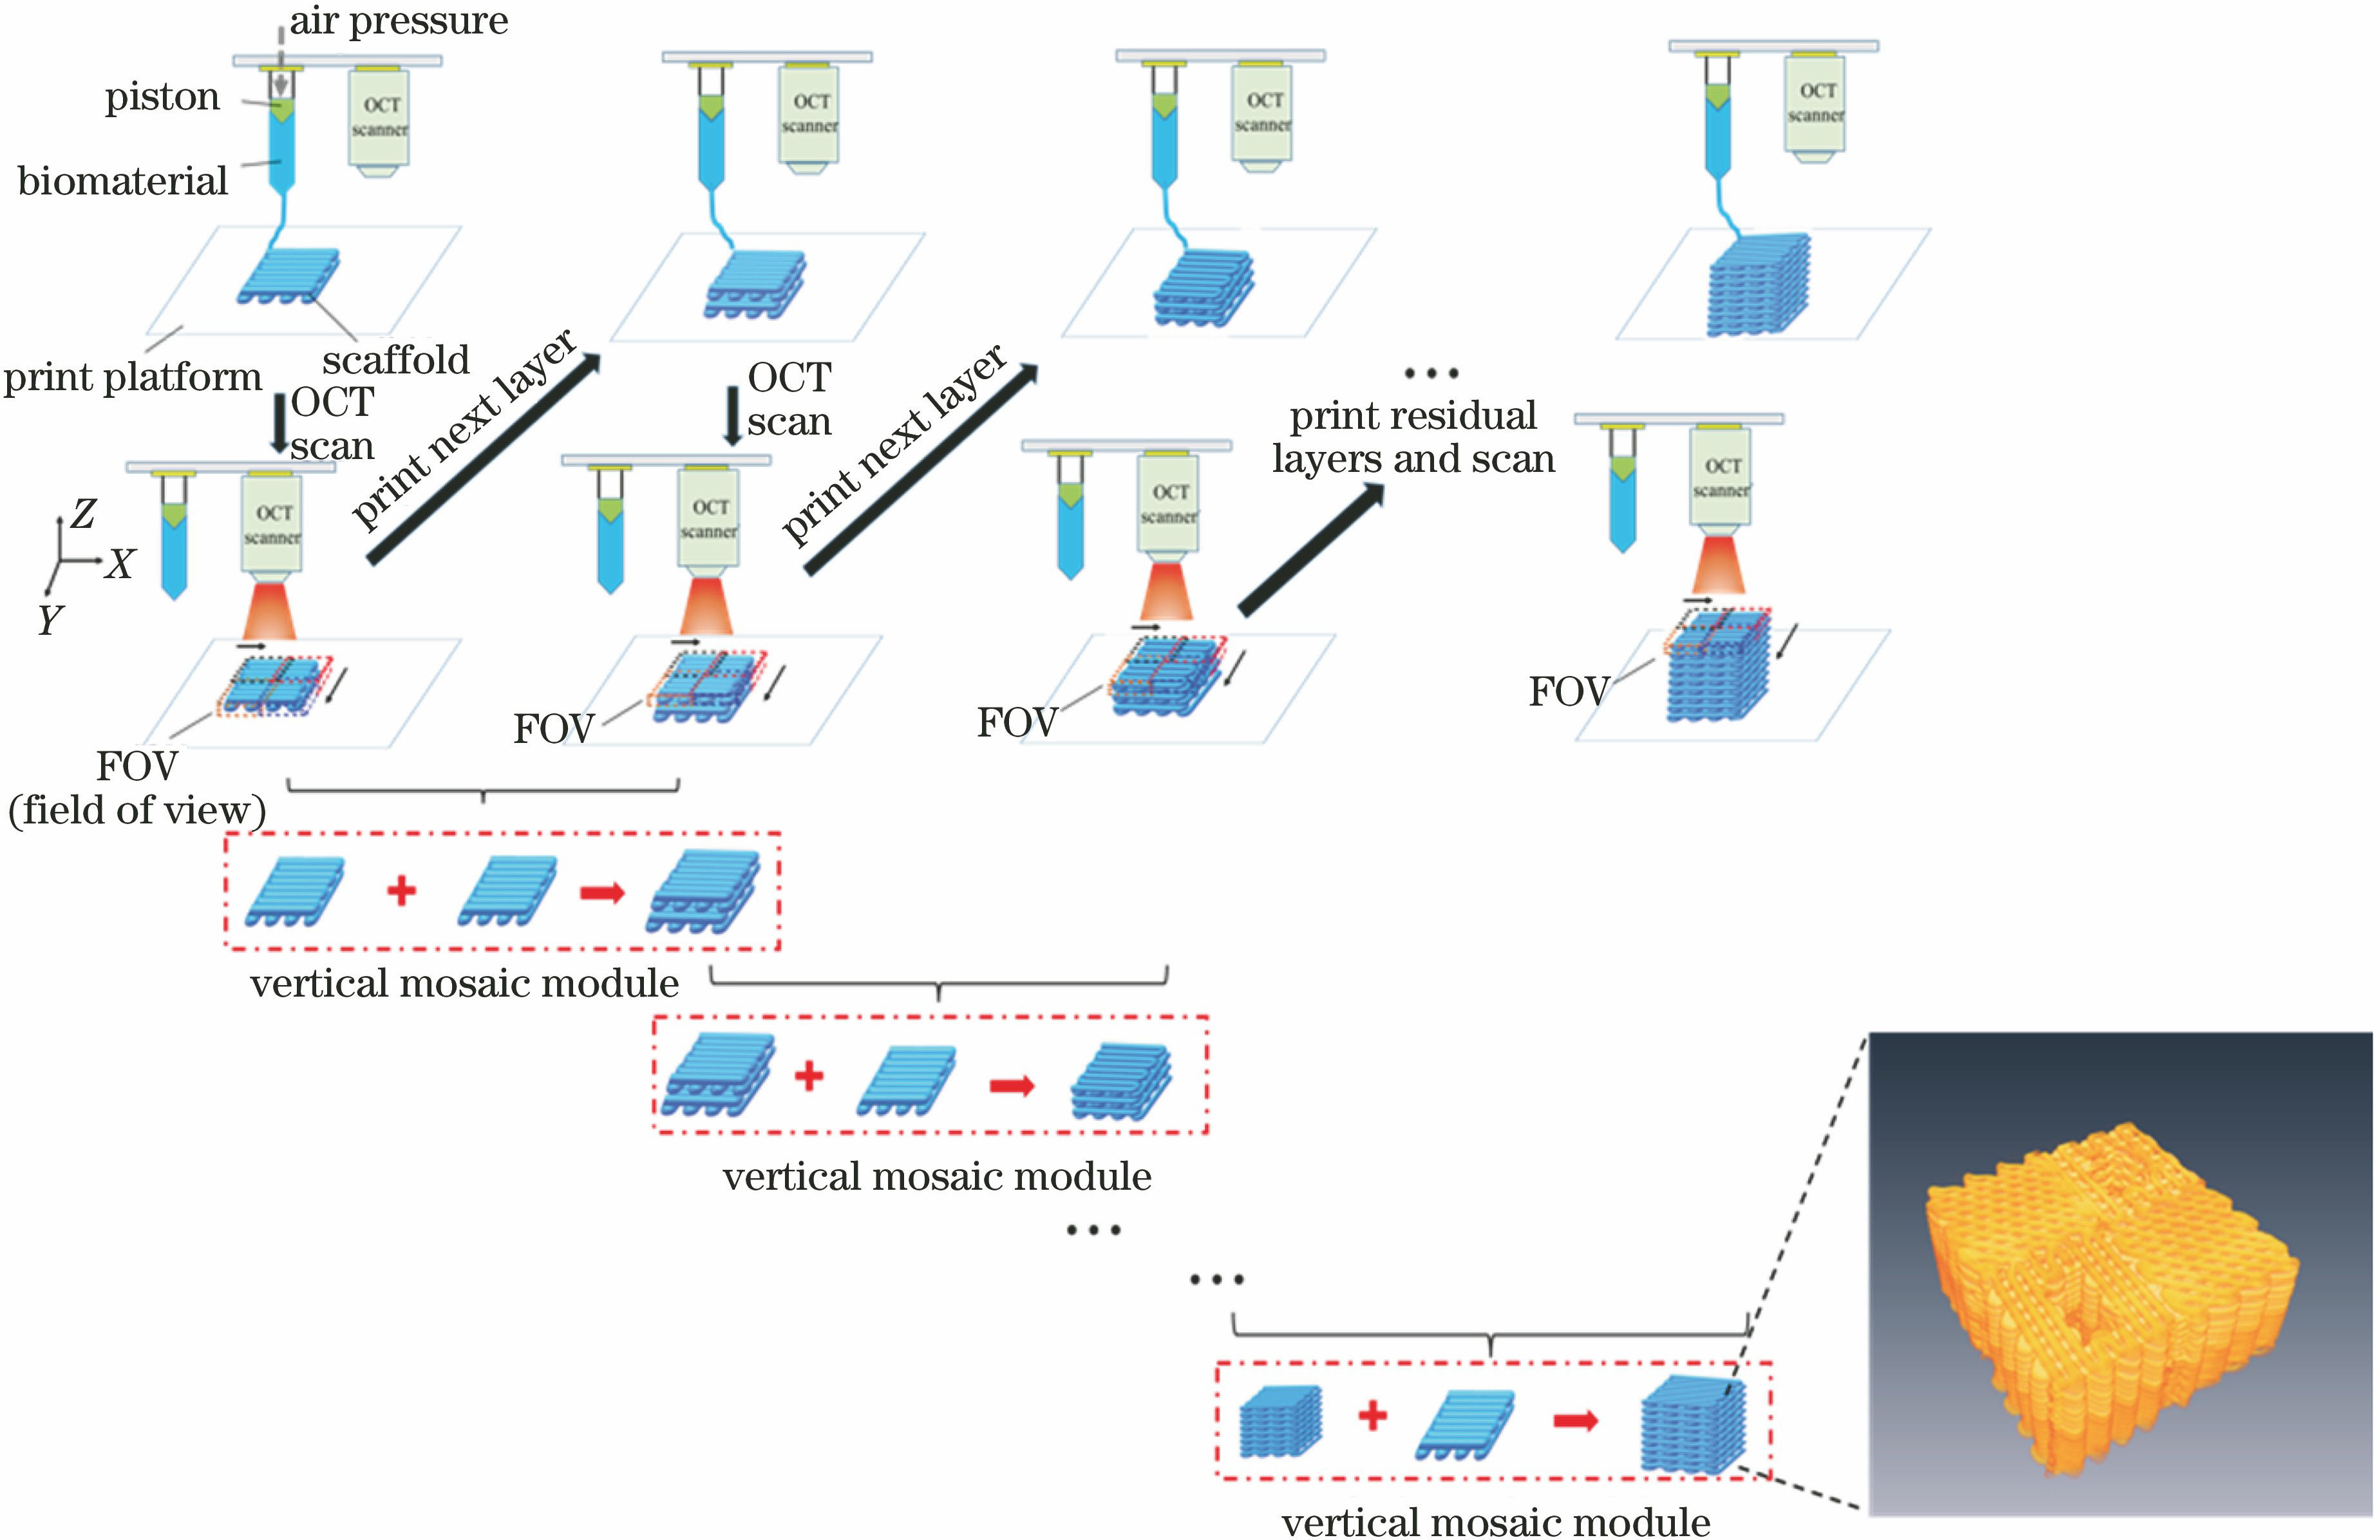
Fig. 1. Flow chart of image acquisition in M-OCT

Fig. 2. Flowchart of M-OCT post-process. (a)(b) Flowchart of mosaic combination in X and Y directions; (c) flow chart of vertical stack-fusion
Fig. 3. Scaffold design model and its printing path. (a) 3D model of tissue engineering scaffold; (b) hierarchical path diagram of tissue engineering scaffold
Fig. 4. Comparison of M-OCT with Micro-CT and OCT. (a) Comparison between M-OCT and Micro-CT 3D models; (b) different printing layers selected in different XZ transverse images by M-OCT; (c) comparison between M-OCT of selected region in Fig.4 (b) and OCT
Fig. 5. Comparison between M-OCT and Micro-CT. (a) Comparison of XZ cross-sections; (b) comparison of YZ cross-sections; (c) thickness curves of each layer in different cross-sections of M-OCT
Fig. 6. Comparison between M-OCT and Micro-CT at XY (en-face) images
Fig. 7. Pore size of scaffold in each area under different thicknesses. (a) Schematic of region selection; (b) measured pore size versus thickness of scaffold based on M-OCT; (c) statistical analysis of pore size in each area based on M-OCT
Fig. 8. Strut size of scaffold in each area at different printing layers. (a) Schematic of region selection of the 30th layer; (b) measured strut size in each area versus number of printing layers of scaffold based on M-OCT; (c) statistical analysis of measured strut size of each printing layer based on M-OCT

Set citation alerts for the article
Please enter your email address
© Copyright 2018-2021 | Chinese Laser Press. All Rights Reserved 沪ICP备15018463号-20