
Liangcai Qiao. SAR Image Target Recognition Method Combining Multi-Resolution Representation and Complex Domain CNN[J]. Laser & Optoelectronics Progress, 2020, 57(24): 241007
- Laser & Optoelectronics Progress
- Vol. 57, Issue 24, 241007 (2020)
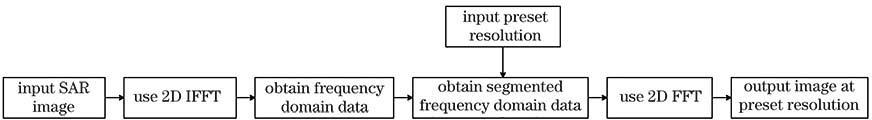
Fig. 1. Flow chart of multi-resolution representation algorithm
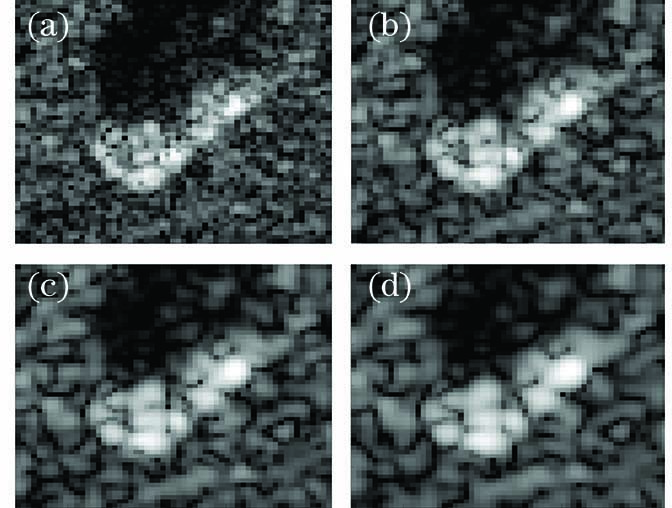
Fig. 2. SAR image targets under different resolutions. (a) Original image; (b) 0.4m; (c) 0.5m; (d) 0.6m
Fig. 3. Flow chart of obtaining label distribution
Fig. 4. Convergence curve of network training process
Fig. 5. Feature maps of proposed network output. (a) Input image; (b) first convolutional layer
Fig. 6. Flow chart of SAR image target recognition process combining multi-resolution representation and complex domain CNN
Fig. 7. Schematic of target to be identified. (a) BMP2; (b) BRT70; (c) T72; (d) T62; (e) BRDM2; (f) BTR60; (g) ZSU23/4; (h) D7; (i) ZIL131; (j) 2S1
Fig. 8. Identification results of 10 categories of targets under standard operating conditions
Fig. 9. Comparison curves of different methods under random noise identification problem
|
Table 1. Number of images for training and test samples under standard operating conditions
|
Table 2. Average recognition rates of different methods under standard operating conditions
|
Table 3. Number of images for training and test samples in model identification problems
|
Table 4. Average recognition rates of different methods under model recognition problem
|
Table 5. Number of images for training and test samples in pitch angle recognition problem
| ||||||||||||||||||||
Table 6. Average recognition rates of different methods under pitch angle recognition problem

Set citation alerts for the article
Please enter your email address
© Copyright 2018-2021 | Chinese Laser Press. All Rights Reserved 沪ICP备15018463号-20