• Acta Optica Sinica
  • Vol. 37, Issue 11, 1128002 (2017)
Zhe Li1、2, Fei Zhang1、2、3、*, Haikuan Feng4, Lihua Chen5, and Xiaoqiang Zhu1、2
Author Affiliations
  • 1 College of Resource and Environment Sciences, Xinjiang University, Urumqi, Xinjiang 830046, China
  • 2 Key Laboratory of Oasis Ecology, Ministry of Education, Xinjiang University, Urumqi, Xinjiang 830046, China
  • 3 General Institutes of Higher Learning Key Laboratory of Smart City and Environmental Modeling, Xinjiang University, Urumqi, Xinjiang 830046, China
  • 4 Beijing Research Center for Information in Agriculture, Beijing 100097, China
  • 5 Area Management Bureau of Ebinur Lake Wetland Natural Reserve, Bole, Xinjiang 833400, China
  • show less
    DOI: 10.3788/AOS201737.1128002 Cite this Article Set citation alerts
    Zhe Li, Fei Zhang, Haikuan Feng, Lihua Chen, Xiaoqiang Zhu. Research on the Estimation of Salt Ions of Vegetation Leaves Based on Band Combination[J]. Acta Optica Sinica, 2017, 37(11): 1128002 Copy Citation Text show less
    Map of study area and distribution of sampling points
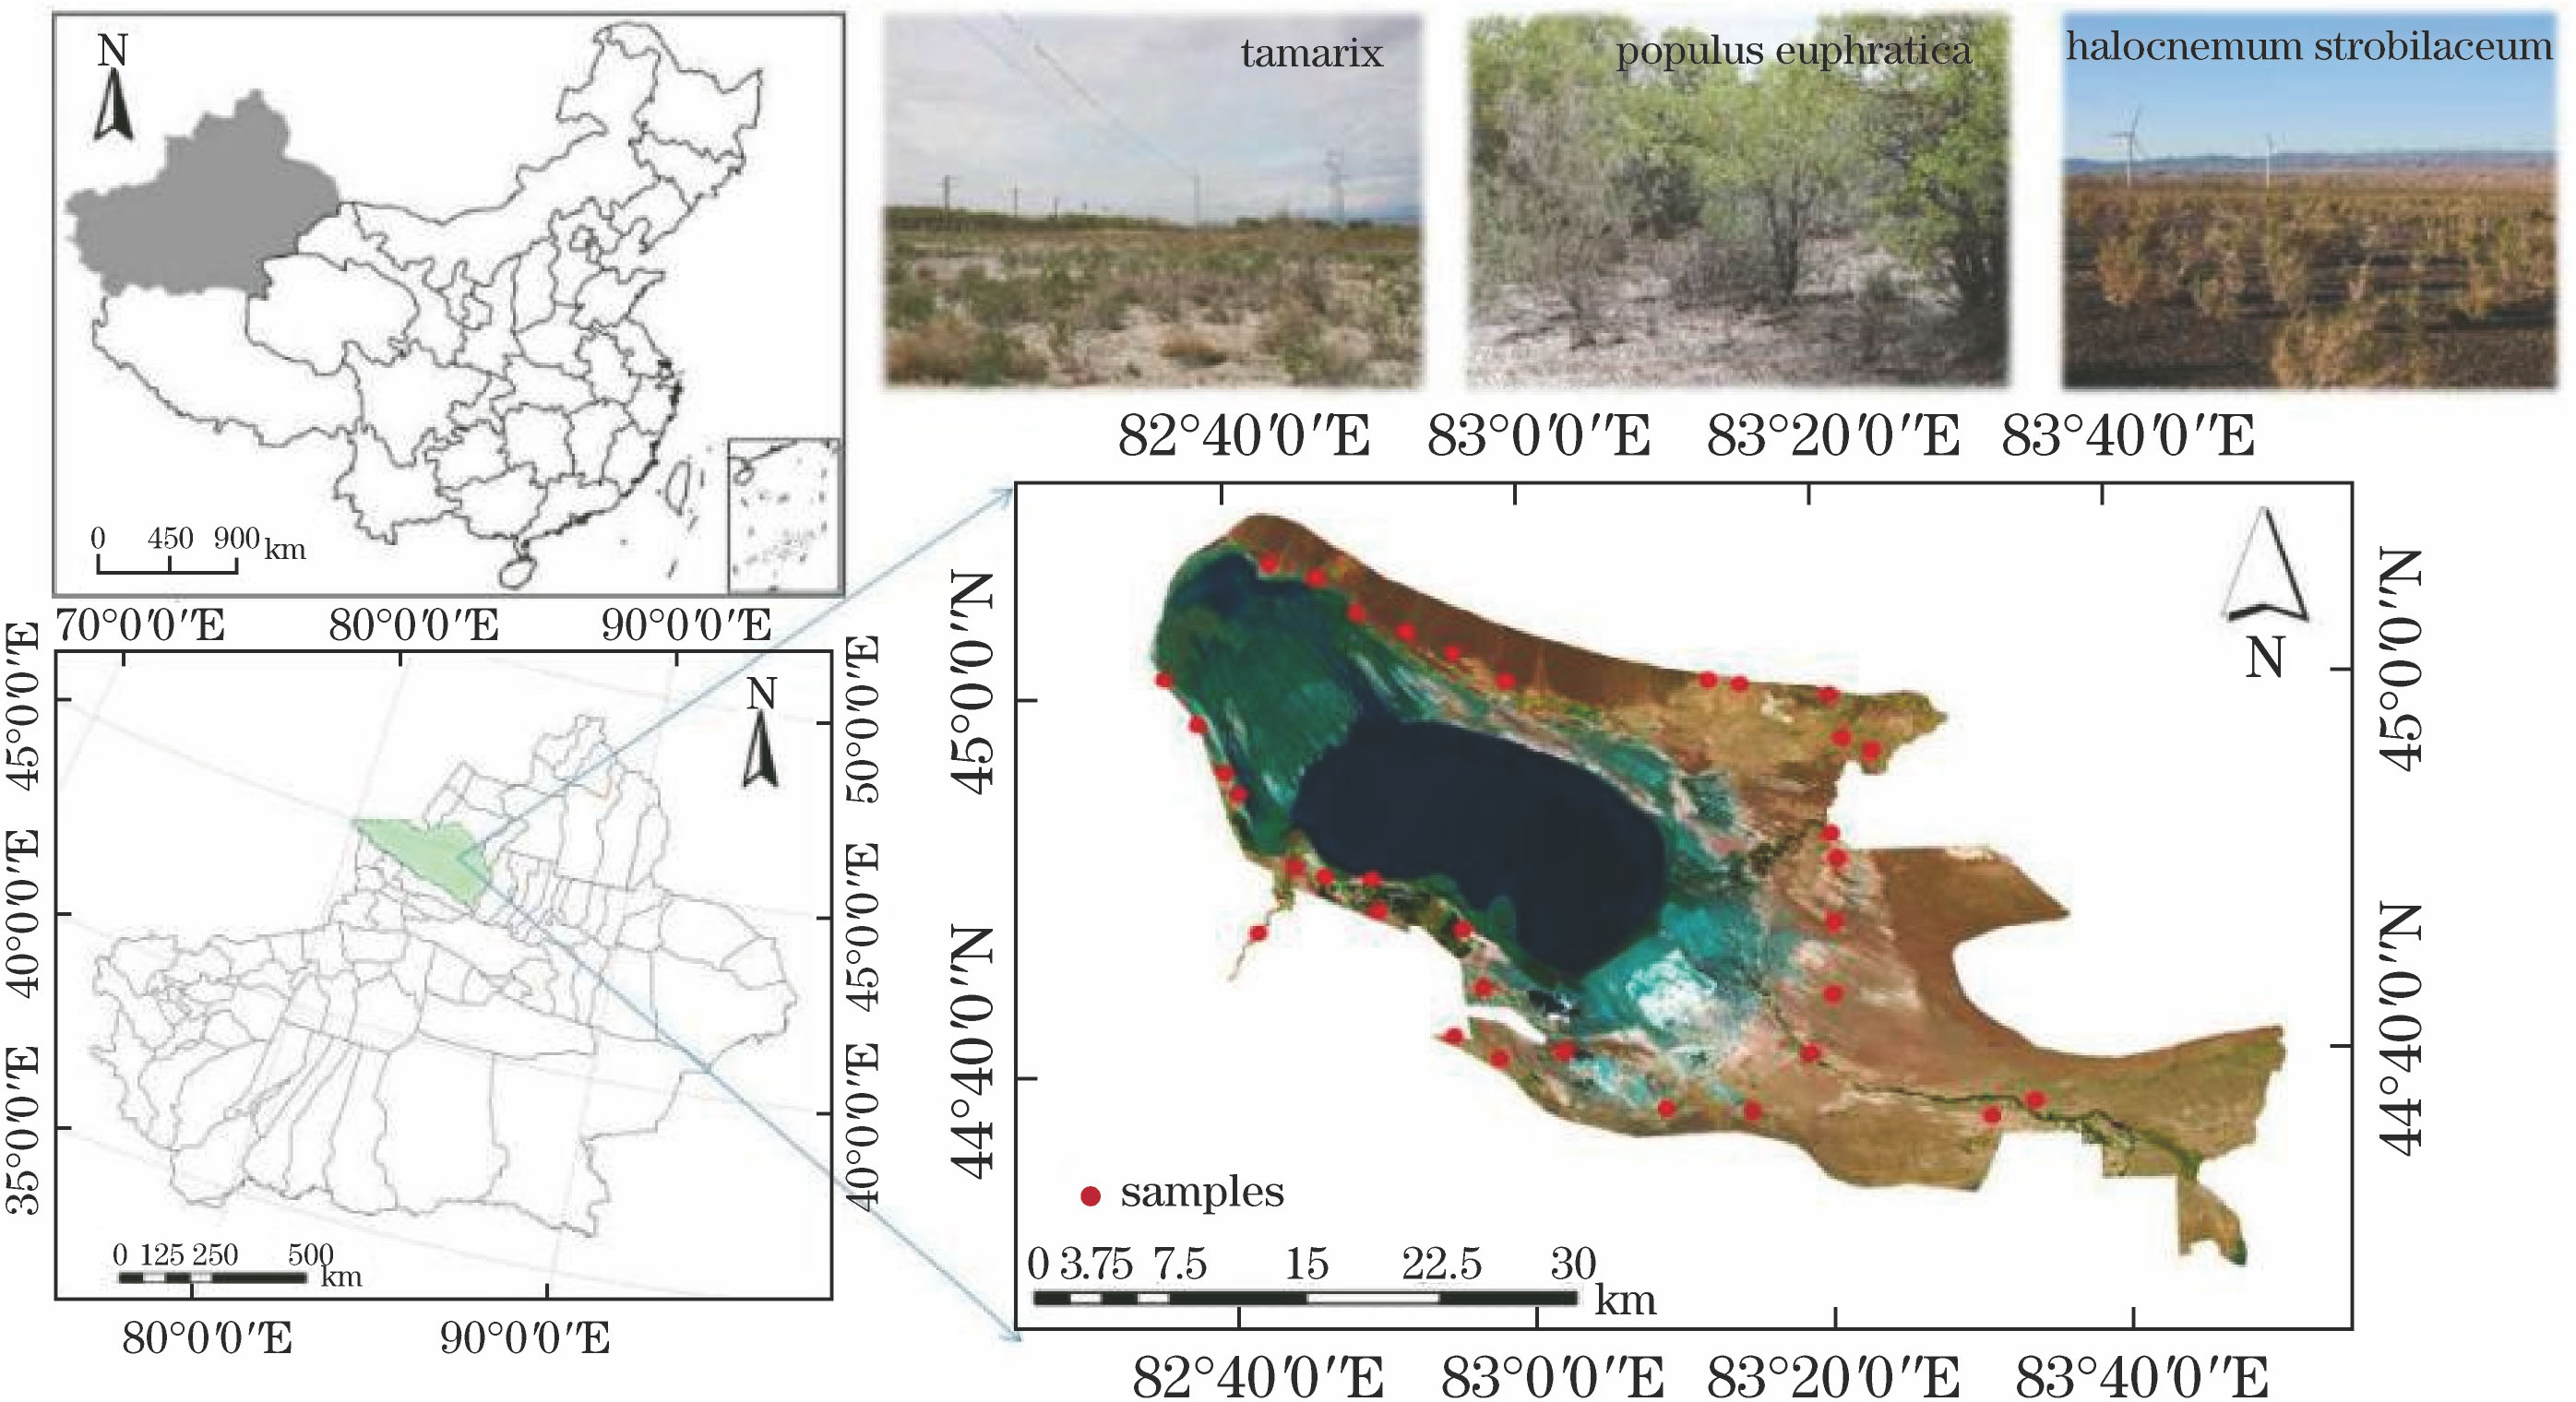
    Fig. 1. Map of study area and distribution of sampling points
    Spatial distribution of halophytes with different salt ion contents. (a) Ca2+; (b) K+; (c) Mg2+; (d) Na+
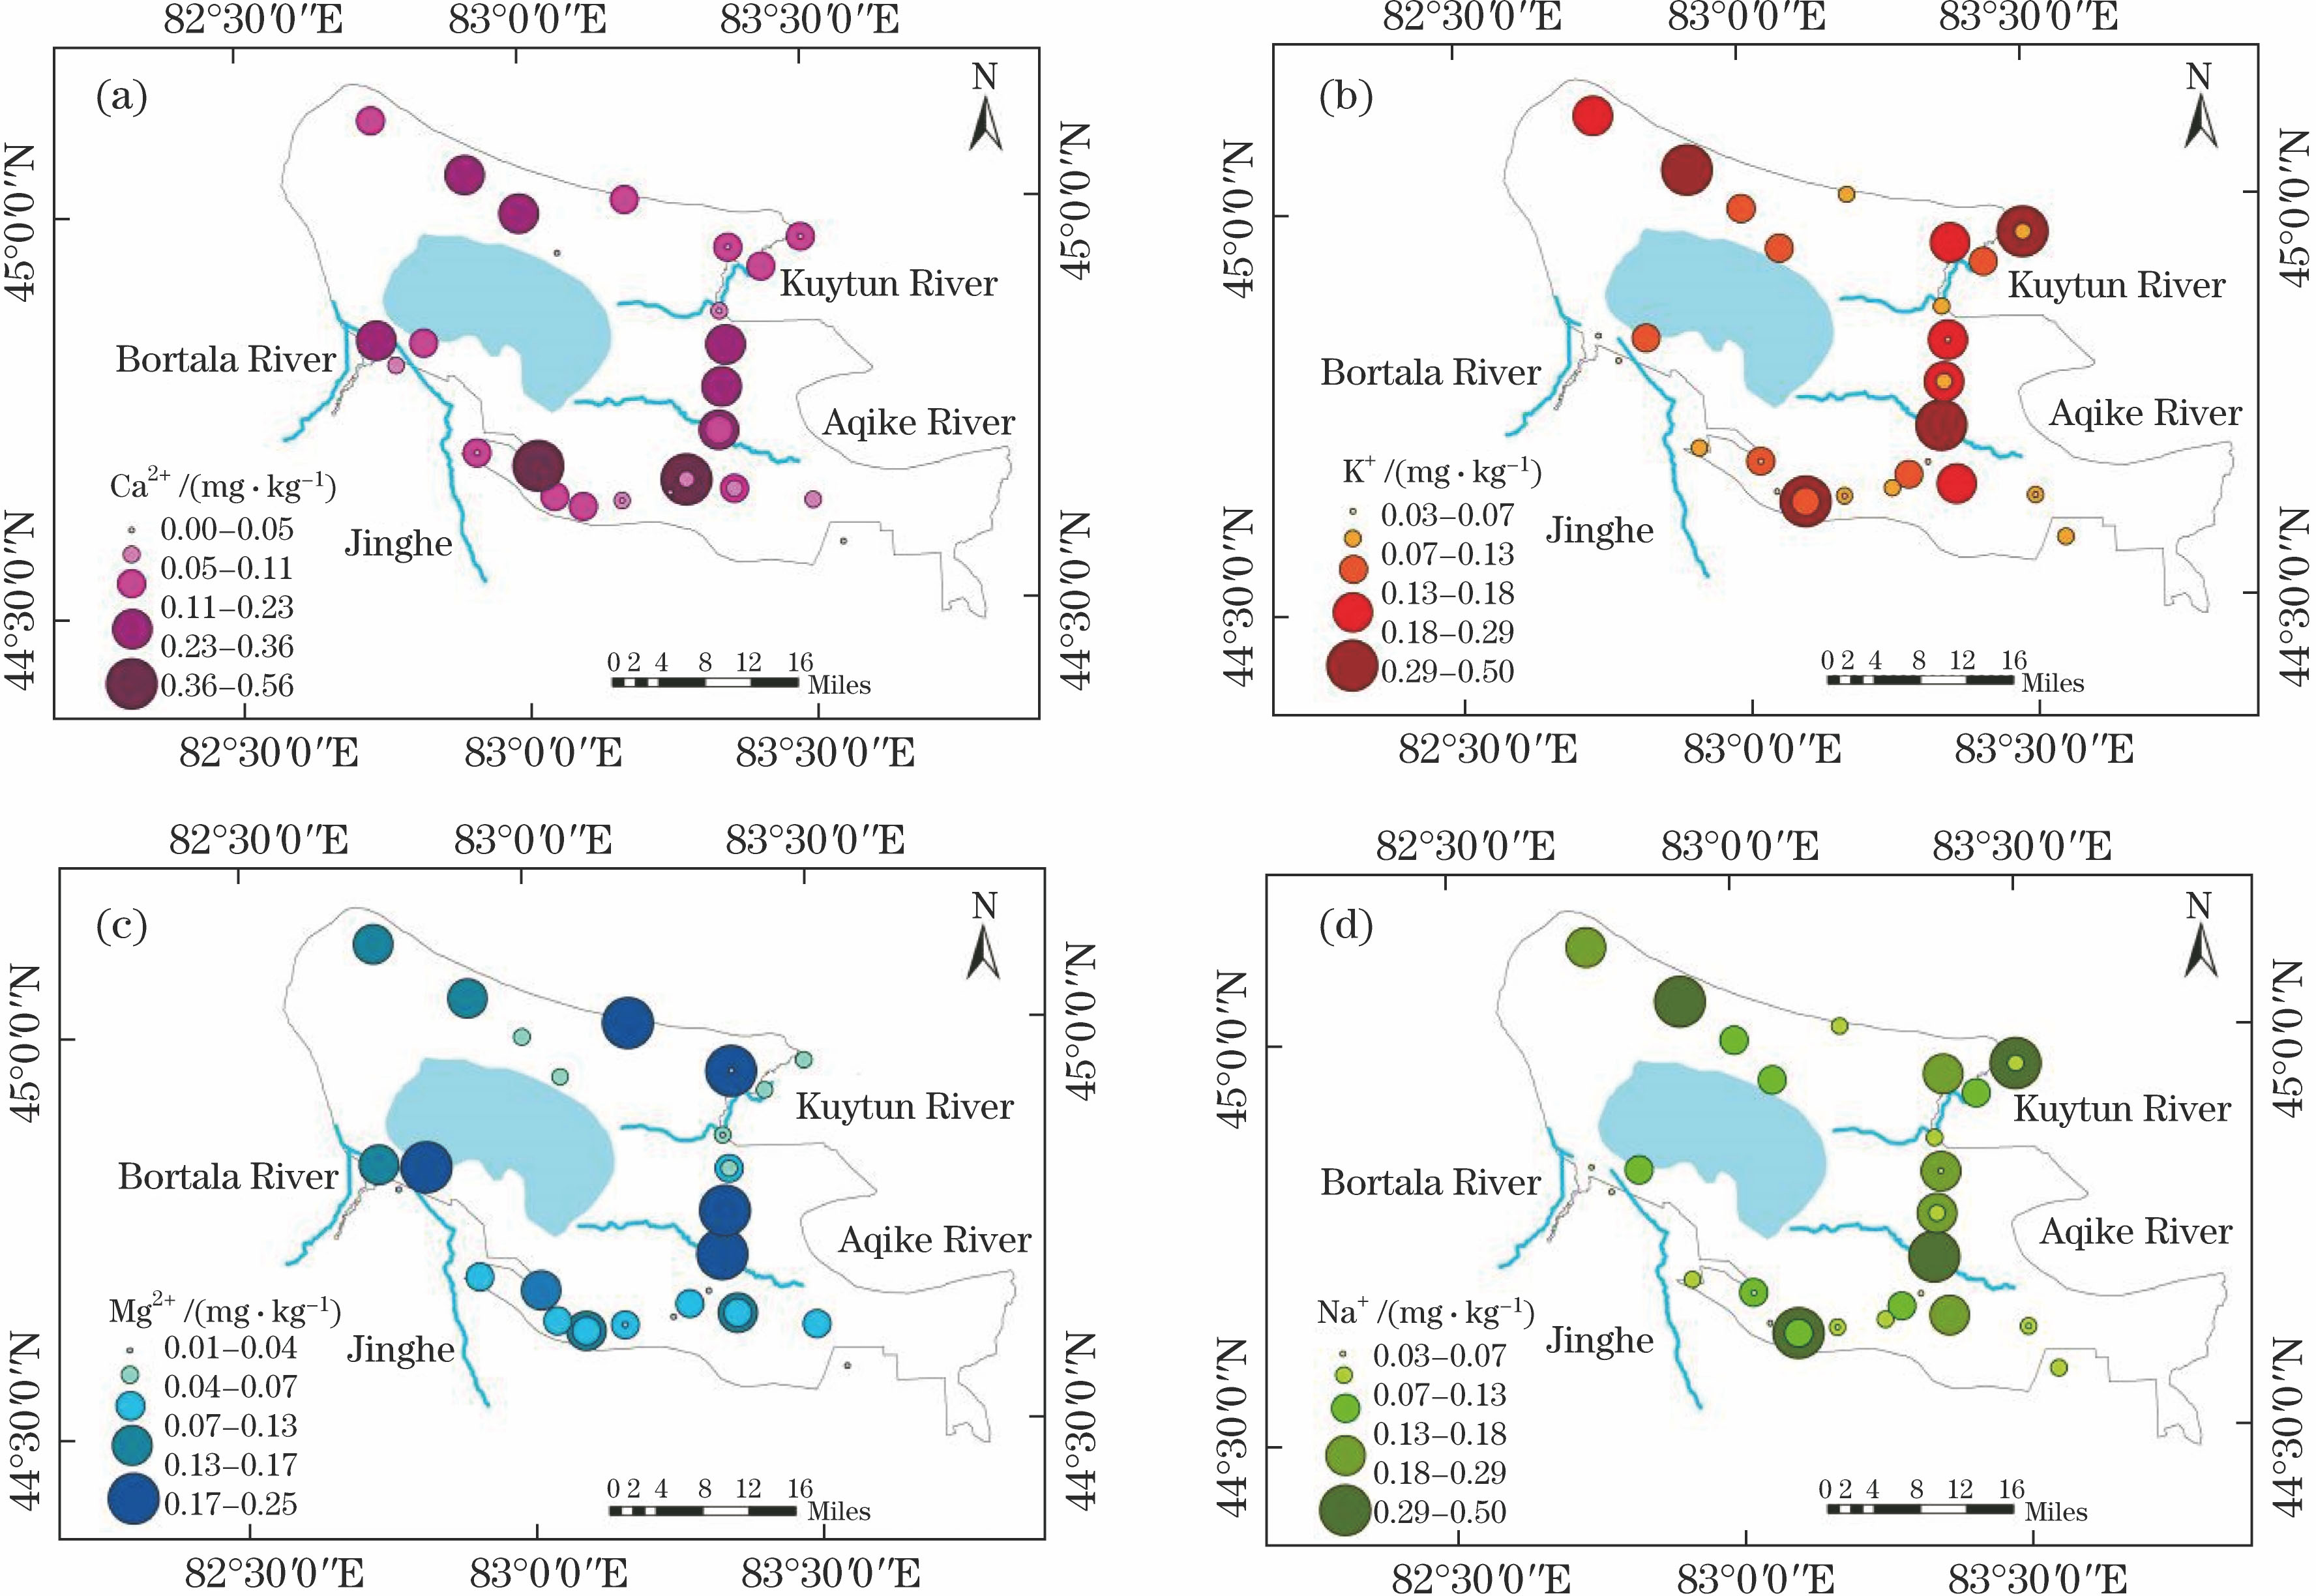
    Fig. 2. Spatial distribution of halophytes with different salt ion contents. (a) Ca2+; (b) K+; (c) Mg2+; (d) Na+
    Correlation coefficient between salt ion content of leaves and original spectral reflectivity
    Fig. 3. Correlation coefficient between salt ion content of leaves and original spectral reflectivity
    Coefficient of determination between salt ion content of leaves and DVI. (a) Ca2+; (b) K+; (c) Mg2+; (d) Na+
    Fig. 4. Coefficient of determination between salt ion content of leaves and DVI. (a) Ca2+; (b) K+; (c) Mg2+; (d) Na+
    Coefficient of determination between salt ion content of leaves and NDSI. (a) Ca2+; (b) K+; (c) Mg2+; (d) Na+
    Fig. 5. Coefficient of determination between salt ion content of leaves and NDSI. (a) Ca2+; (b) K+; (c) Mg2+; (d) Na+
    Coefficient of determination between salt ion content of leaves and RVI. (a) Ca2+; (b) K+; (c) Mg2+; (d) Na+
    Fig. 6. Coefficient of determination between salt ion content of leaves and RVI. (a) Ca2+; (b) K+; (c) Mg2+; (d) Na+
    P-P plot and histogram of observed values and predicted values with different vegetation indices. (a) NDSI; (b) DVI; (c) RVI
    Fig. 7. P-P plot and histogram of observed values and predicted values with different vegetation indices. (a) NDSI; (b) DVI; (c) RVI
    Salinity contentSpectrum parameterRegression equationRVRMSEF-test
    K+VDVI(R415,R380)y=4.288x+0.1190.4660.10110.834
    y=94.495x2+2.450x+0.1140.4890.1006.252
    y=-1458.3x3+140.958x2+2.601x+0.1100.4990.1014.092
    Na+VDVI(R1750,R1480)y=-0.387ln x-0.5760.7450.19848.685
    y=29.573x2-10.682x+1.07260.7590.19625.741
    y=-5.142x3+31.108x2-10.813x+1.0760.7600.19816.709
    Ca2+VDVI(R478,R440)y=5.129x+0.1060.3820.1246.661
    y=18.973x2+4.652x+0.1070.3820.1263.252
    y=-7417.186x3+246.728x2+4.248x+0.0970.3920.1272.234
    Mg2+VDVI(R478,R440)y=0.043ln x+0.3080.4360.0599.166
    y=1.259x0.5770.4480.7709.782
    y=-42643.662x3-1775.032x2+25.233x-0.0040.4520.0603.170
    Table 1. Quantitative relationships between salt ion content of leaves and optimum DVI
    Salinity contentSpectrum parameterRegression equationRVRMSEF-test
    K+VNDSI(R412,R375)y=0.835x+0.1190.4820.09911.834
    y=3.326x2+0.520x+0.1120.5000.1006.346
    y=19.853x3+0.599x2+0.466x+0.1170.5030.1014.170
    Na+VNDSI(R1145,R1125)y=-9.619x-0.0220.7440.19848.450
    y=-7.9612x2-10.469x-0.040.7440.20023.625
    y=-216.53x3-43.902x2-12.214x-0.06360.7450.20315.342
    Ca2+VNDSI(R1825,R950)y=-0.038x+0.1450.3290.0854.721
    y=0.0002x2-0.038x+0.1450.3290.1292.300
    y=0.002x3+0.004x2-0.047x+0.1380.3350.1301.557
    Mg2+VNDSI(R450,R375)y=0.230x+0.0660.4030.0607.571
    y=0.047exp(3.232x)0.4290.7788.804
    y=-13.866x3+7.978x2-0.817x+0.0760.6100.0537.304
    Table 2. Quantitative relationships between salt ion content of leaves and optimum NDSI
    Salinity contentSpectrum parameterRegression equationRVRMSEF-test
    K+VRVI(R405,R375)y=0.538x-0.4110.5200.09714.430
    y=1.551x2-2.781x+1.3450.5490.0968.179
    y=9.750x3-29.747x2+30.455x-10.3320.5610.0968.268
    Na+VRVI(R1100,R1125)y=4.790x-4.7890.6340.22926.274
    y=36.317x2-74.407x+38.3350.6750.22215.889
    y=-620.76x3+2078.8x2-2314.3x+855.8100.6980.09516.416
    Ca2+VRVI(R1825,R1125)y=-0.460x+0.7220.3240.1254.588
    y=-0.693x2+1.272x-0.3540.3290.1272.308
    y=8.619x3-33.457x2+42.588x-17.6380.3400.1252.301
    Mg2+VRVI(R1675,R1475)y=-0.044x+0.1890.3440.0615.245
    y=-0.010x2+0.003x+0.1370.3480.0622.613
    y=0.009x3-0.079x2+0.170x+0.0070.3490.0631.712
    Table 3. Quantitative relationships between salt ion content of leaves and optimum RVI
    Zhe Li, Fei Zhang, Haikuan Feng, Lihua Chen, Xiaoqiang Zhu. Research on the Estimation of Salt Ions of Vegetation Leaves Based on Band Combination[J]. Acta Optica Sinica, 2017, 37(11): 1128002
    Download Citation