• Laser & Optoelectronics Progress
  • Vol. 57, Issue 5, 053003 (2020)
Liangkun Huang1、2、*, Quan Wen1、2、**, Zhiyu Wen1、2, Fan Yu1、2, Haitao Liu2, Mingjian Hong2, and Yingke Xie1、2
Author Affiliations
  • 1Key Laboratory of Fundamental Science of Micro/Nano-Device and System Technology, Chongqing University, Chongqing 400044, China
  • 2Microsystem Research Center, Chongqing University, Chongqing 400044, China
  • show less
    DOI: 10.3788/LOP57.053003 Cite this Article Set citation alerts
    Liangkun Huang, Quan Wen, Zhiyu Wen, Fan Yu, Haitao Liu, Mingjian Hong, Yingke Xie. Micro-Ultraviolet Spectrometer Analysis System[J]. Laser & Optoelectronics Progress, 2020, 57(5): 053003 Copy Citation Text show less
    Schematic of analyzing process
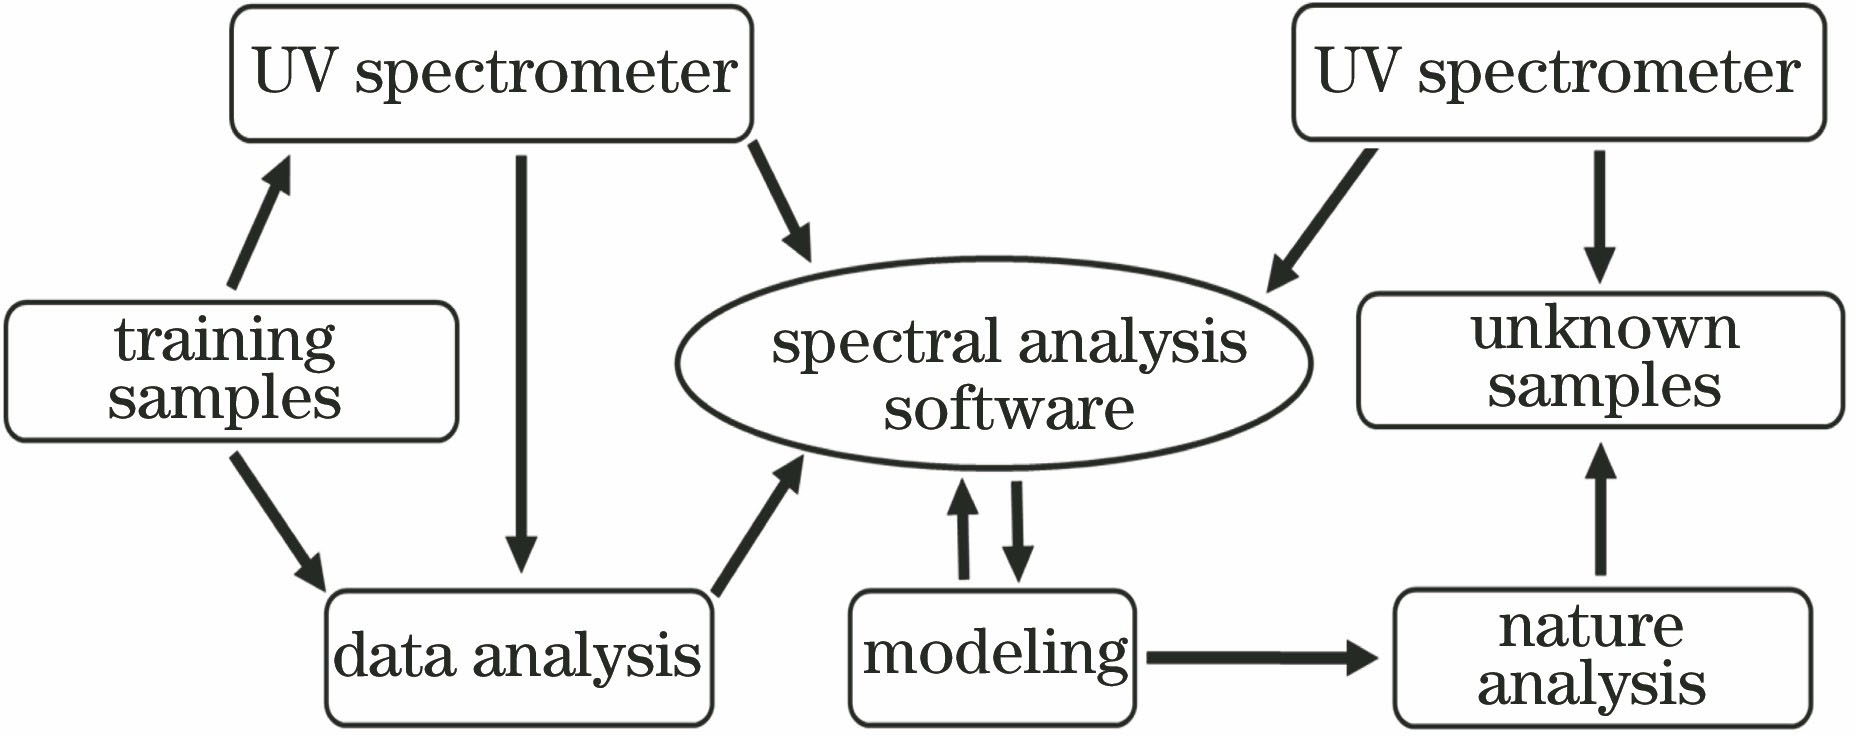
    Fig. 1. Schematic of analyzing process
    Simulation results of the flat field holographic concave grating
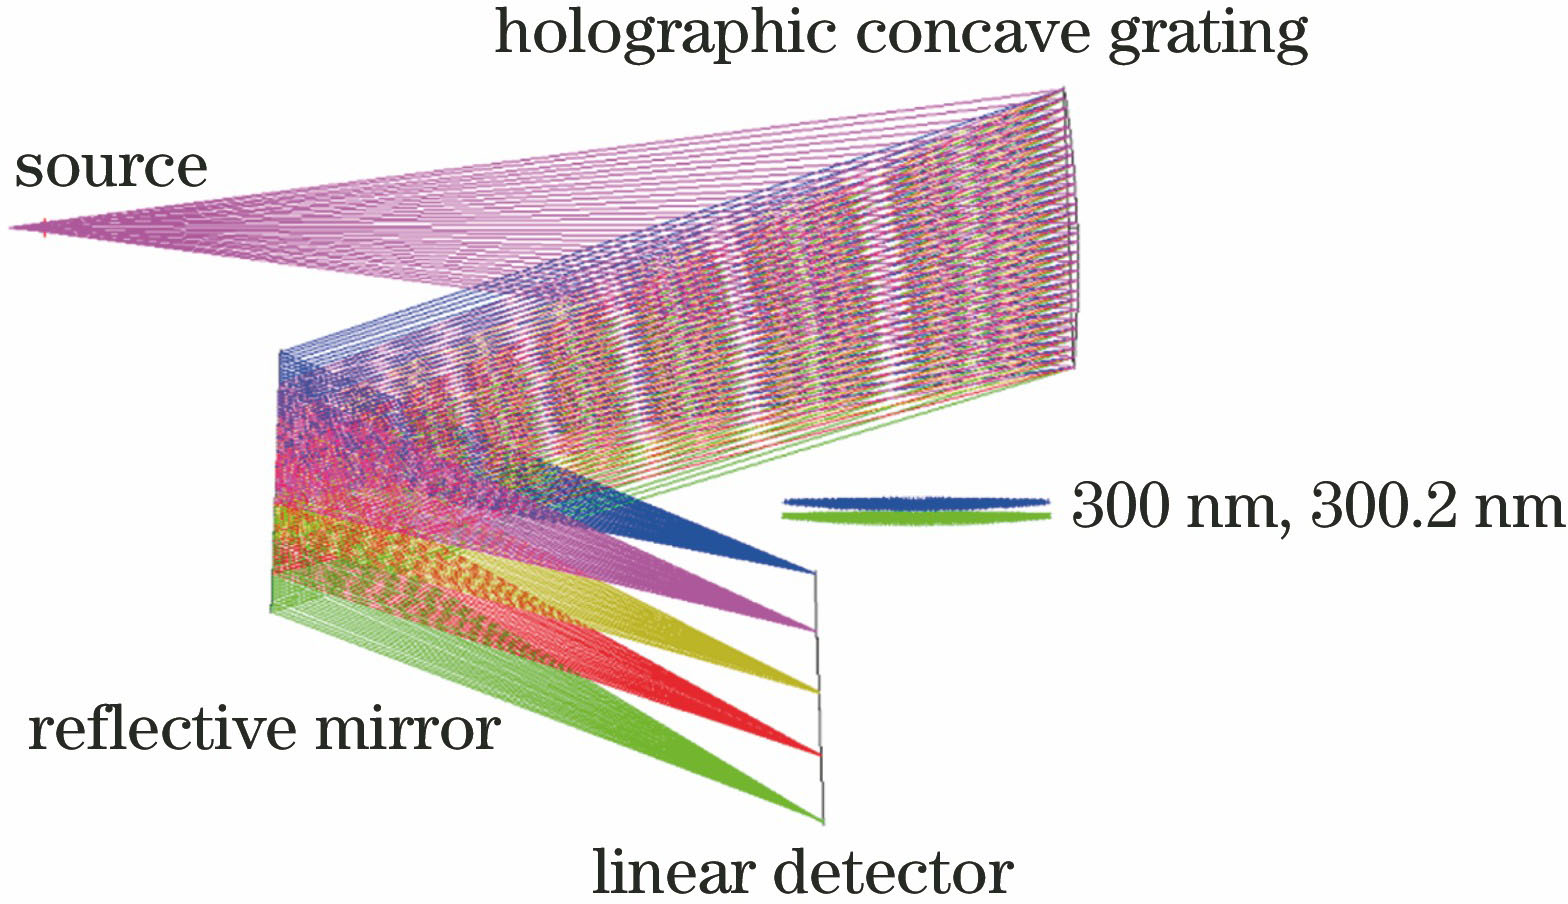
    Fig. 2. Simulation results of the flat field holographic concave grating
    Schematic of spectral analysis system configuration
    Fig. 3. Schematic of spectral analysis system configuration
    Spectral range and calibration results of the spectrometer prototype. (a) Wavelength range; (b) calibrated spectral curve
    Fig. 4. Spectral range and calibration results of the spectrometer prototype. (a) Wavelength range; (b) calibrated spectral curve
    Hg lamp resolution test curve
    Fig. 5. Hg lamp resolution test curve
    Test results of system stability. (a) 12 sets of test data chart; (b) 12 h test data scatter chart
    Fig. 6. Test results of system stability. (a) 12 sets of test data chart; (b) 12 h test data scatter chart
    Gas detection and analysis system. (a) Physical picture of test system; (b) deuterium lamp-ultraviolet spectrometer measurement system
    Fig. 7. Gas detection and analysis system. (a) Physical picture of test system; (b) deuterium lamp-ultraviolet spectrometer measurement system
    Absorption spectrum of SO2 gas and filtered SO2 differential absorption cross section at 215-238 nm and 290-311 nm
    Fig. 8. Absorption spectrum of SO2 gas and filtered SO2 differential absorption cross section at 215-238 nm and 290-311 nm
    Theoreticalwavelength /nmMeasuredwavelength /nmRelativeerror /nm
    253.65253.58-0.07
    265.37265.32-0.05
    275.28275.280
    289.36289.29-0.07
    296.73296.64-0.09
    302.15302.11-0.04
    312.57312.670.1
    334.15334.08-0.07
    365.01365.040.03
    Table 1. Test data of wavelength accuracy
    GasconcentrationActual concentration /(mg·m-3)Max value /(mg·m-3)Min value /(mg·m-3)Avg value /(mg·m-3)Wave /%Error /%
    Concentration of SO22020.267819.466920.00340.800.53
    3030.081429.479629.80160.600.52
    5050.391449.727349.94890.660.39
    8080.121579.602279.93030.520.40
    100100.369599.438999.93560.930.56
    Concentration of N20.3905-0.33120.0280.720.39
    Table 2. Measurement results of SO2 gas mass concentration in UV spectrometer
    Liangkun Huang, Quan Wen, Zhiyu Wen, Fan Yu, Haitao Liu, Mingjian Hong, Yingke Xie. Micro-Ultraviolet Spectrometer Analysis System[J]. Laser & Optoelectronics Progress, 2020, 57(5): 053003
    Download Citation