Author Affiliations
1 Department of Information Engineering, China University of Geosciences, Wuhan, Hubei 430074, China2 National Engineering Research Center of Geographic Information System, Wuhan, Hubei 430074, China3 Department of Information Science and Technology, Wenhua College, Wuhan, Hubei 430074, Chinashow less
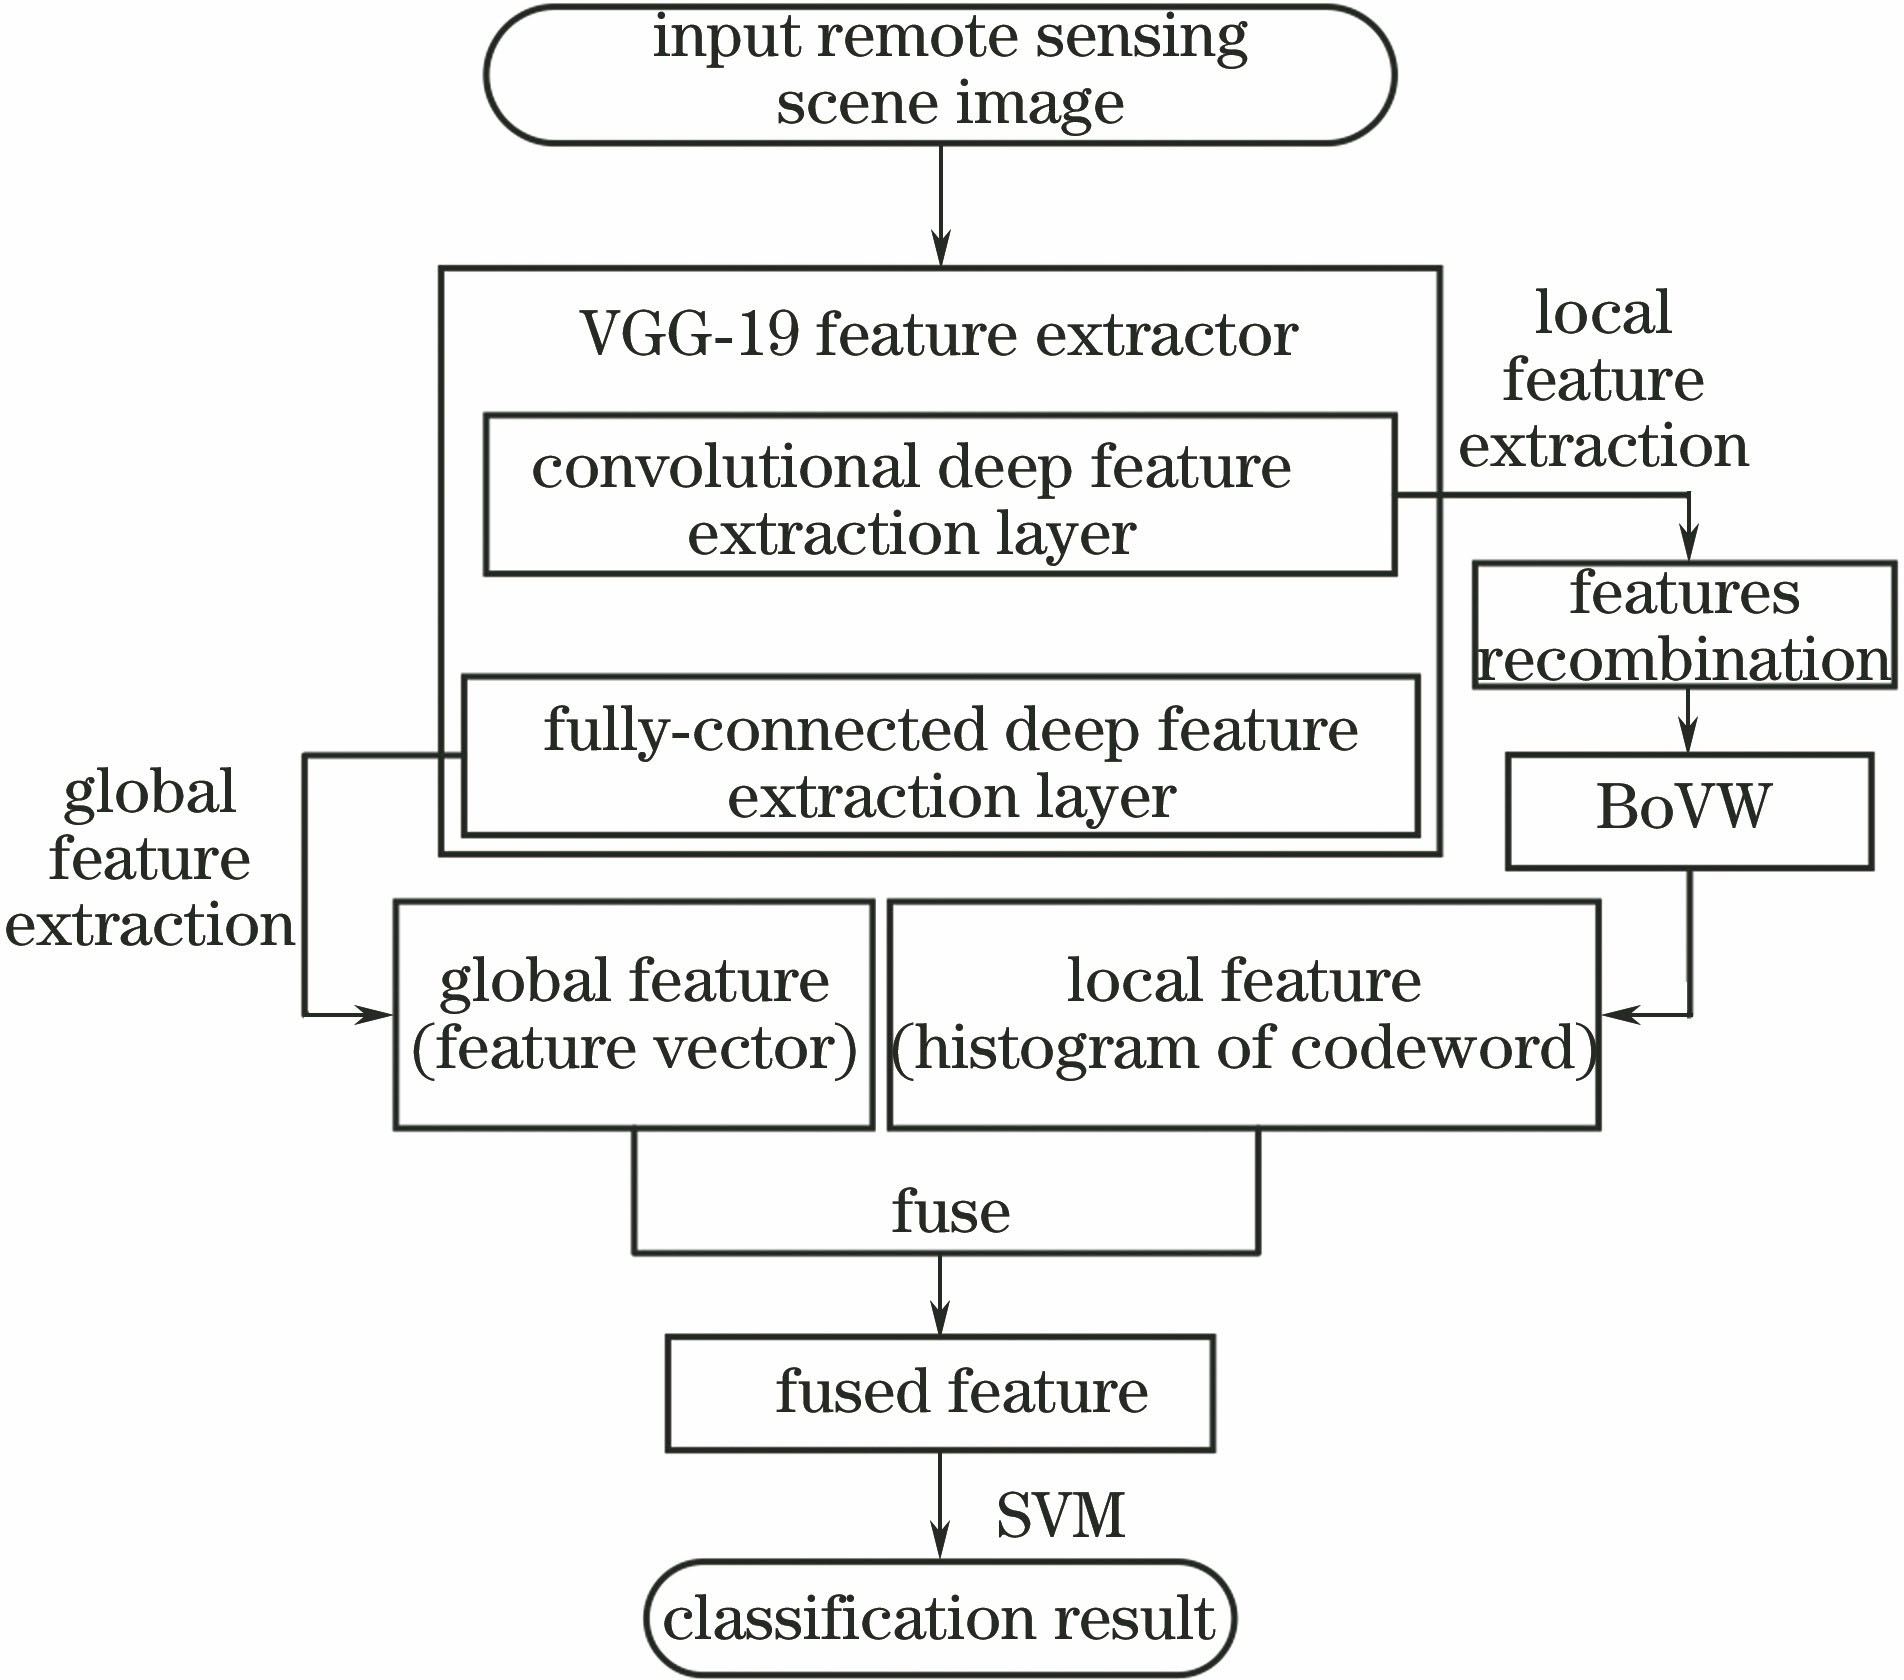
Fig. 1. Flow chart of GLDFB
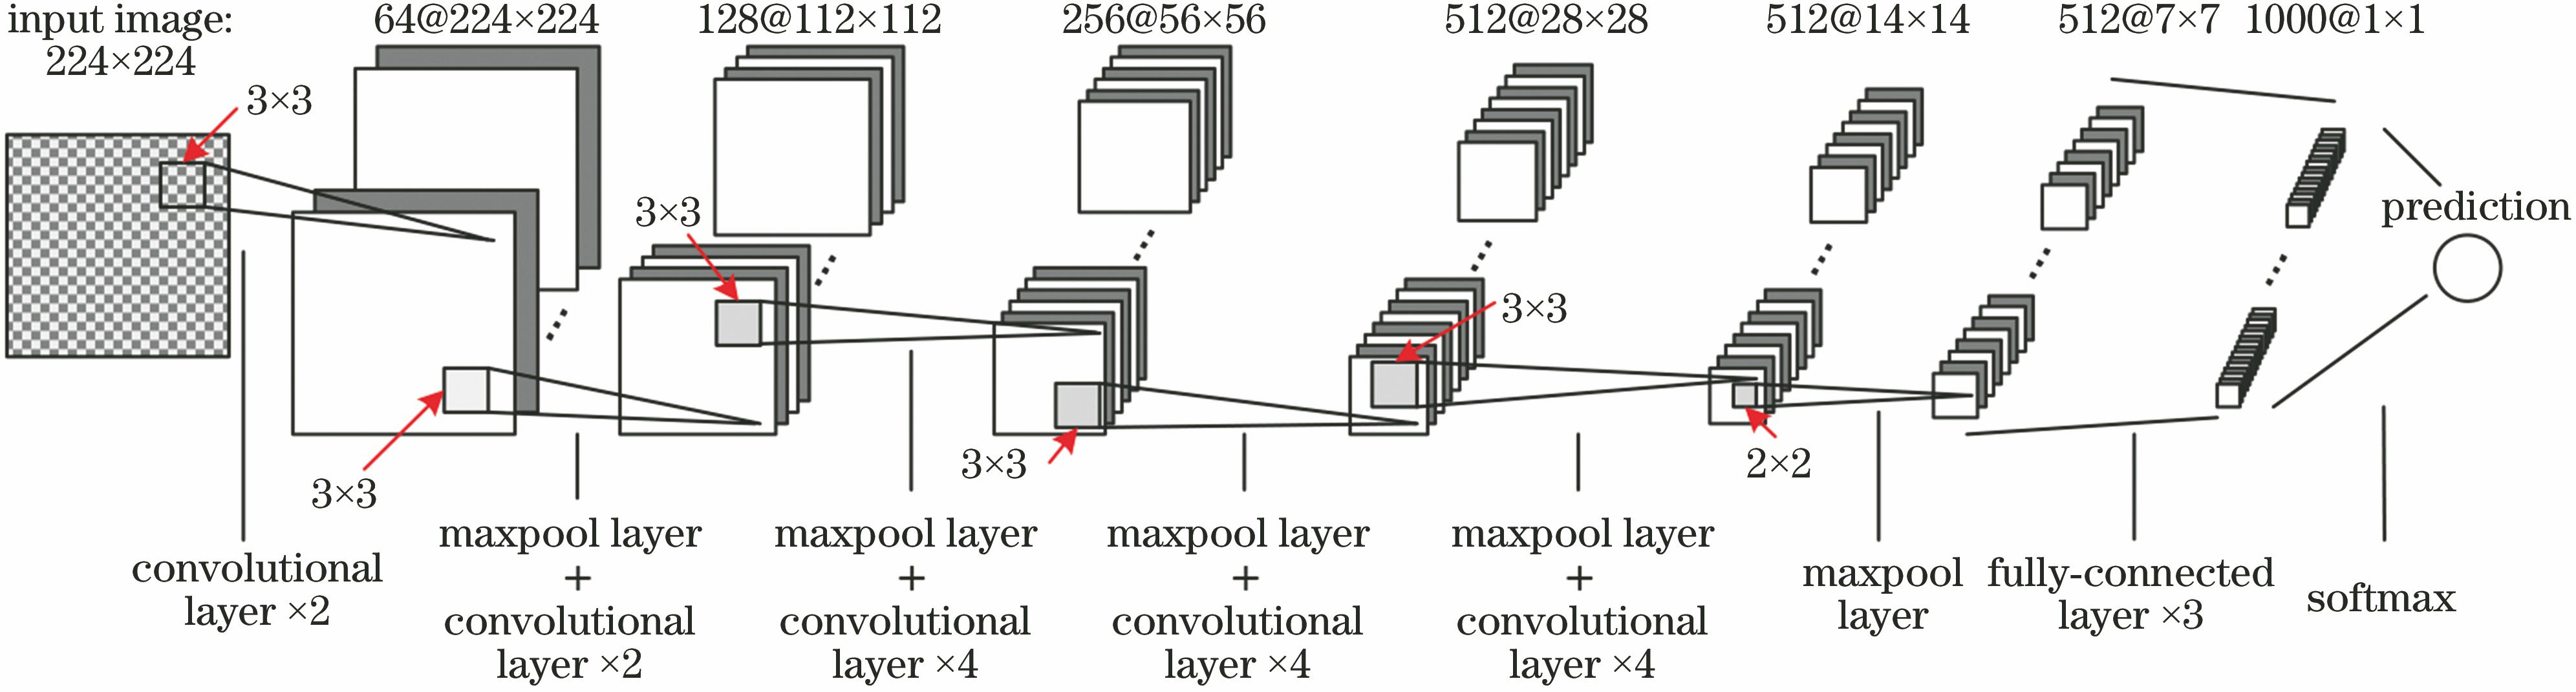
Fig. 2. Network structure of VGG-19
Fig. 3. Reconstruction and coding of convolutional layer features
Fig. 4. Image examples of remote sensing scene. (a) UCM dataset; (b) SIRI dataset
Fig. 5. Time consumption for single iteration in k-means clustering process of 12 convolutional layer features under different K values. (a) UCM dataset; (b) SIRI dataset
Fig. 6. Classification accuracies of 12 convolutional layer features under different K values. (a) UCM dataset; (b) SIRI dataset
Fig. 7. Classification confusion matrix of GLDFB on UCM dataset
Fig. 8. Two kinds of misclassified scenes. (a) Road type; (b) building type
Fig. 9. Classification confusion matrix of GLDFB on SIRI dataset
Fig. 10. GLDFB results. (a) USGS large remote sensing image; (b) classification result
No. | Layer name | Feature size |
---|
1 | conv1_1 | 64×224× 224 | 2 | conv1_2 | 64×224× 224 | 3 | conv2_1 | 128×112×112 | 4 | conv2_2 | 128×112×112 | 5 | conv3_1 | 256×56×56 | 6 | conv3_2 | 256×56×56 | 7 | conv3_3 | 256×56×56 | 8 | conv3_4 | 256×56×56 | 9 | conv4_1 | 512×28×28 | 10 | conv4_2 | 512×28×28 | 11 | conv4_3 | 512×28×28 | 12 | conv4_4 | 512×28×28 | 13 | conv5_1 | 512×14×14 | 14 | conv5_2 | 512×14×14 | 15 | conv5_3 | 512×14×14 | 16 | conv5_4 | 512×14×14 |
|
Table 1. Output feature dimensions of VGG-19 convolutional layers
Layer type | UCM | SIRI |
---|
K=100 | K=500 | K=1000 | K=2000 | K=3000 | K=100 | K=500 | K=1000 | K=1500 | K=2000 |
---|
Middle layer | 90.14 | 94.24 | 94.60 | 95.89 | 95.42 | 91.22 | 93.49 | 93.91 | 94.58 | 94.32 | Middle-high layer | 89.76 | 95.18 | 95.42 | 95.95 | 96.49 | 89.48 | 93.96 | 94.51 | 94.91 | 95.16 | High layer | 88.87 | 94.46 | 94.94 | 95.42 | 94.88 | 87.80 | 92.12 | 92.88 | 93.65 | 93.44 |
|
Table 2. Average classification accuracy comparison of three kinds of convolutional layer features under different K values
Dataset | UCM | SIRI |
---|
Feature | HOG | SIFT | LBP | CNN (6conv+2fc) | HOG | SIFT | LBP | CNN (6conv+2fc) | Accuracy /% | 52.14 | 58.33 | 31.43 | 63.10 | 44.79 | 53.96 | 46.25 | 60.42 |
|
Table 3. Classification accuracies of several other features
No. | Feature | Accuracy /% |
---|
UCM | SIRI |
---|
1 | FC6 | 94.60 | 93.54 | 2 | conv4_1 | 96.90 | 95.63 | 3 | SIFT+HOG | 73.81 | 67.92 | 4 | SIFT+FC6 | 95.00 | 95.00 | 5 | GLDFB(conv4_1+FC6) | 97.62 | 96.67 |
|
Table 4. Classification accuracy comparison of many kinds of features
No. | Method | Accuracy /% |
---|
1 | RF | 44.77 | 2 | SIFT+BoVW | 76.81 | 3 | SPCK[4] | 77.38 | 4 | VGG-19 (training from scratch) | 83.48 | 5 | Resnet50 (training from scratch) | 85.71 | 6 | CaffeNet[11] | 93.42±1.00 | 7 | DCT-CNN[7] | 95.76 | 8 | GLDFB | 97.62 |
|
Table 5. Classification accuracy comparison on UCM dataset
No. | Method | Accuracy /% |
---|
1 | RF | 49.90 | 2 | SIFT+BoVW | 75.63 | 3 | SPMK[3] | 77.69±1.01 | 4 | VGG-19(training from scratch) | 86.13 | 5 | MeanStd-SIFI+LDA-H[17] | 86.29 | 6 | Resnet50(training from scratch) | 89.26 | 7 | GLDFB | 96.67 |
|
Table 6. Classification accuracy comparison on SIRI dataset
Pre-training model | Local feature extraction layer | Accuracy /% |
---|
Local feature | Global feature | Fused feature |
---|
Alexnet[18] | conv3 | 93.81 | 95.24 | 96.91 | Caffenet[19] | conv3 | 94.05 | 96.90 | 97.62 | VGG-F[20] | conv3 | 95.24 | 96.19 | 97.62 | VGG-M[20] | conv3 | 95.00 | 96.43 | 97.62 | VGG-S[20] | conv3 | 93.81 | 96.43 | 96.67 | VGG-16[14] | conv4_1 | 95.00 | 96.19 | 95.95 | Resnet50[21] | Res3a | 95.71 | 96.90 | 97.86 | Resnet101[21] | Res3a | 95.23 | 96.90 | 97.86 |
|
Table 7. Classification results of GLDFB with other pre-training CNNs