
Huanjian Deng, Shangyuan Li, Shiming Yang, Qiang Liu, Minming Geng. Broadband Linearization of Microwave Photonic Link Based on Single-Drive Dual-Parallel Mach-Zehnder Modulator[J]. Laser & Optoelectronics Progress, 2022, 59(17): 1713002
- Laser & Optoelectronics Progress
- Vol. 59, Issue 17, 1713002 (2022)
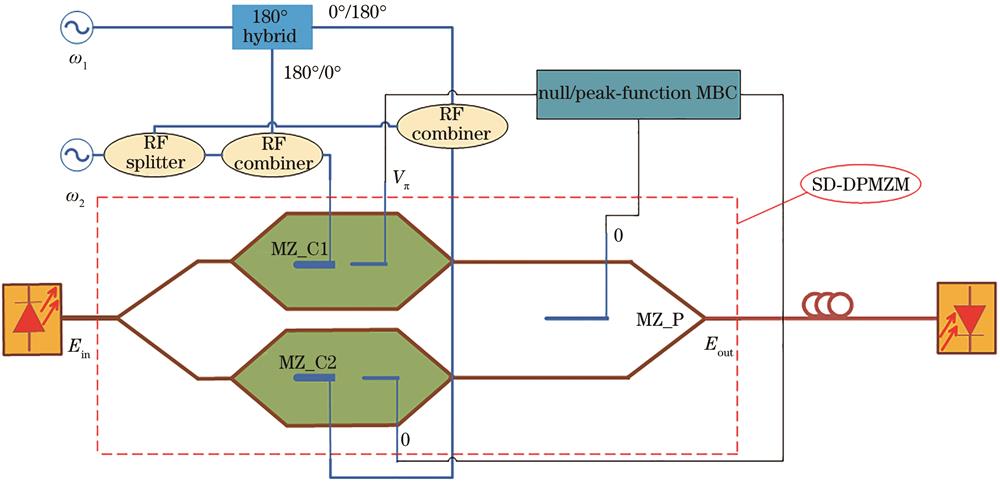
Fig. 1. Schematic diagram of the broadband linearized MPL using SD-DPMZM
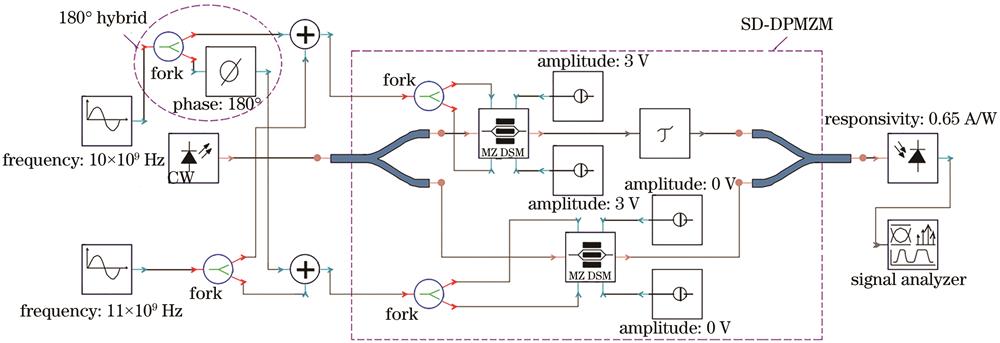
Fig. 2. Simulation model of the broadband linearized MPL using SD-DPMZM
Fig. 3. Simulated electrical spectrum after PD. (a) Conventional quadrature biased MZM; (b) proposed linearized SD-DPMZM scheme, two tone frequencies at 10 GHz and 10.01 GHz (
Fig. 4. Simulation of IMD3 influencing factors in the system. (a) Ideal input; (b) the relationship between input phase and input power of two RF signals
Fig. 5. Simulation of FOH, IMD3 and SFDR influencing factors in the system. (a) Influence of phase deviation (Dphase) and bias voltage deviation (
Fig. 6. Measured electrical spectrum after PD, two tone frequencies at 10 GHz and 10.01 GHz. (a) Conventional quadrature biased MZM; linearized SD-DPMZM scheme: (b) 10 GHz and 10.01 GHz; (c) 10 GHz and 10.1 GHz; (d) 10 GHz and 10.2 GHz
Fig. 7. Measured SFDR of the SD-DPMZM and the conventional MZM, two tone frequencies at 10 GHz and 10.01 GHz
Fig. 8. Measured electrical spectrum and SFDR after PD. (a) (b) two tone frequencies at 16 GHz and 16.01 GHz; (c) (d) two tone frequencies at 18 GHz and 18.01 GHz
Fig. 9. Measurement SFDR of linearized MPL by changing the input phase of DPMZM

Set citation alerts for the article
Please enter your email address
© Copyright 2018-2021 | Chinese Laser Press. All Rights Reserved 沪ICP备15018463号-20